| Red | Green | Blue | |
| z | 17.64 | ||
| znorm | Inf | ||
| sky | -Inf | -NaN | -NaN |
| S/N | 20.7 | 36.3 | 37.9 |
| S/N(c) | 0.0 | 0.0 | 0.0 |
| SN(E/C) |
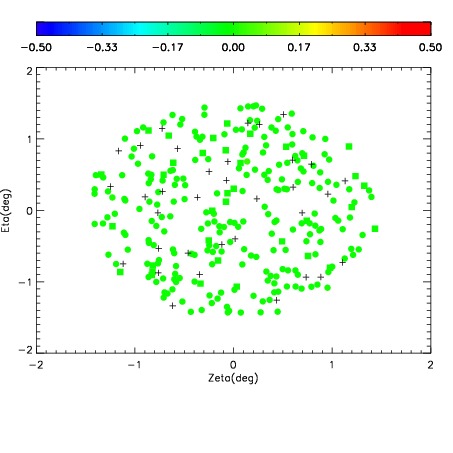
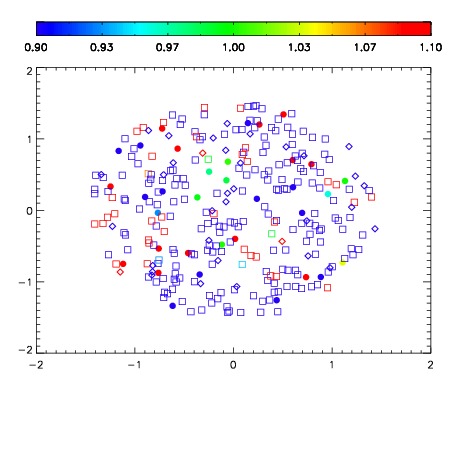
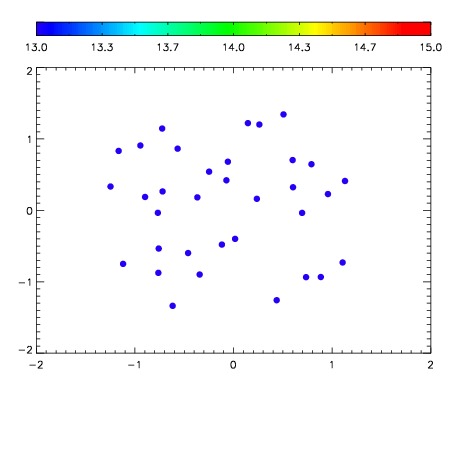

| Frame | Nreads | Zeropoints | Mag plots | Spatial mag deviation | Spatial sky 16325A emission deviations (filled: sky, open: star) | Spatial sky continuum emission | Spatial sky telluric CO2 absorption deviations (filled: H < 10) | |||||||||||||||||||||||
| 0 | 0 |
|
|
|
|
|
|
| IPAIR | NAME | SHIFT | NEWSHIFT | S/N | NAME | SHIFT | NEWSHIFT | S/N |
| 0 | 19730029 | 0.495575 | 0.00000 | 18.3904 | 19730026 | 0.00528075 | 0.490294 | 18.3878 |
| 1 | 19730012 | 0.489175 | 0.00640002 | 18.9206 | 19730011 | 0.00000 | 0.495575 | 18.9578 |
| 2 | 19730017 | 0.489945 | 0.00563002 | 18.7066 | 19730018 | 0.00145869 | 0.494116 | 18.6496 |
| 3 | 19730024 | 0.492496 | 0.00307900 | 18.4414 | 19730023 | 0.00327773 | 0.492297 | 18.4609 |
| 4 | 19730025 | 0.493509 | 0.00206602 | 18.3901 | 19730027 | 0.00614215 | 0.489433 | 18.3378 |
| 5 | 19730028 | 0.495529 | 4.60148e-05 | 18.3100 | 19730030 | 0.00779042 | 0.487785 | 18.3061 |
| 6 | 19730020 | 0.491804 | 0.00377101 | 18.2285 | 19730022 | 0.00408608 | 0.491489 | 18.1896 |
| 7 | 19730021 | 0.493342 | 0.00223300 | 18.1738 | 19730019 | 0.00217428 | 0.493401 | 18.1472 |
| 8 | 19730016 | 0.491466 | 0.00410903 | 18.0873 | 19730015 | 0.000903231 | 0.494672 | 18.0516 |
| 9 | 19730013 | 0.490011 | 0.00556400 | 17.9956 | 19730014 | 0.00127088 | 0.494304 | 18.0406 |