| Red | Green | Blue | |
| z | 17.64 | ||
| znorm | Inf | ||
| sky | -Inf | -Inf | -NaN |
| S/N | 14.7 | 24.2 | 29.8 |
| S/N(c) | 0.0 | 0.0 | 0.0 |
| SN(E/C) |
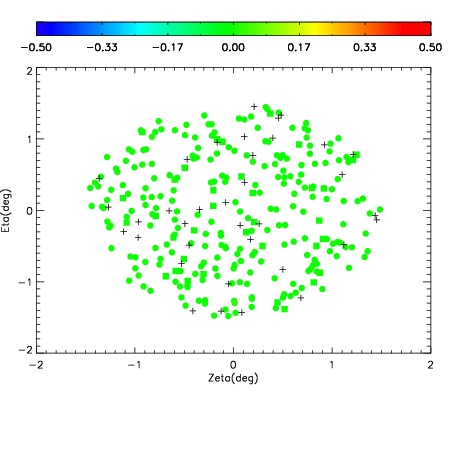
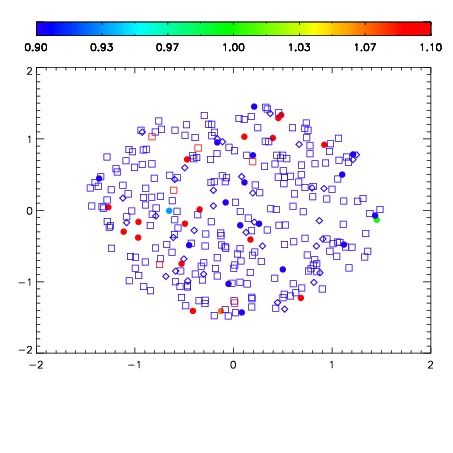
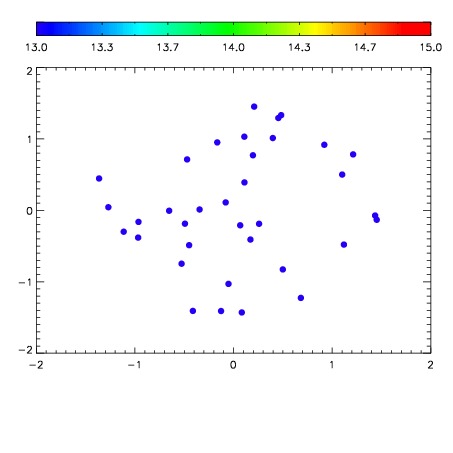

| Frame | Nreads | Zeropoints | Mag plots | Spatial mag deviation | Spatial sky 16325A emission deviations (filled: sky, open: star) | Spatial sky continuum emission | Spatial sky telluric CO2 absorption deviations (filled: H < 10) | |||||||||||||||||||||||
| 0 | 0 |
|
|
|
|
|
|
| IPAIR | NAME | SHIFT | NEWSHIFT | S/N | NAME | SHIFT | NEWSHIFT | S/N |
| 0 | 18990013 | 0.502932 | 0.00000 | 18.3196 | 18990014 | -1.59672e-05 | 0.502948 | 18.3162 |
| 1 | 18990012 | 0.502673 | 0.000259042 | 18.4100 | 18990011 | 0.00000 | 0.502932 | 18.3540 |
| 2 | 18990016 | 0.502536 | 0.000396013 | 17.8227 | 18990015 | -0.000413682 | 0.503346 | 17.8880 |