| Red | Green | Blue | |
| z | 17.64 | ||
| znorm | Inf | ||
| sky | -Inf | -Inf | -Inf |
| S/N | 12.8 | 22.1 | 26.7 |
| S/N(c) | 0.0 | 0.0 | 0.0 |
| SN(E/C) |
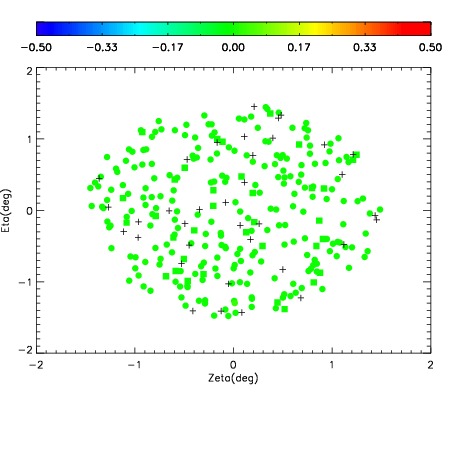
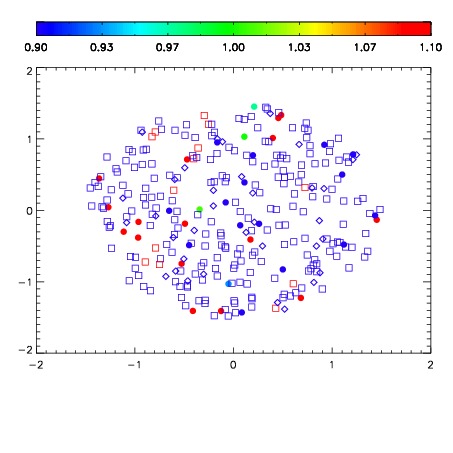


| Frame | Nreads | Zeropoints | Mag plots | Spatial mag deviation | Spatial sky 16325A emission deviations (filled: sky, open: star) | Spatial sky continuum emission | Spatial sky telluric CO2 absorption deviations (filled: H < 10) | |||||||||||||||||||||||
| 0 | 0 |
|
|
|
|
|
|
| IPAIR | NAME | SHIFT | NEWSHIFT | S/N | NAME | SHIFT | NEWSHIFT | S/N |
| 0 | 19000036 | 0.501210 | 0.00000 | 17.9903 | 19000037 | -0.000715944 | 0.501926 | 18.0480 |
| 1 | 19000039 | 0.500042 | 0.00116795 | 18.5176 | 19000038 | -0.00215107 | 0.503361 | 18.5151 |
| 2 | 19000035 | 0.501027 | 0.000182986 | 17.9056 | 19000034 | 0.00000 | 0.501210 | 17.7726 |