| Red | Green | Blue | |
| z | 17.63 | ||
| znorm | Inf | ||
| sky | -Inf | -Inf | -Inf |
| S/N | 27.8 | 45.8 | 52.5 |
| S/N(c) | 0.0 | 0.0 | 0.0 |
| SN(E/C) |
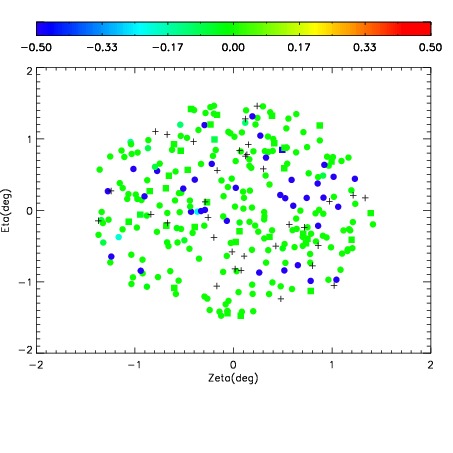
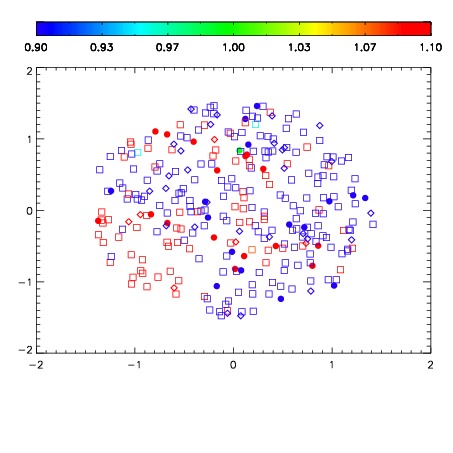
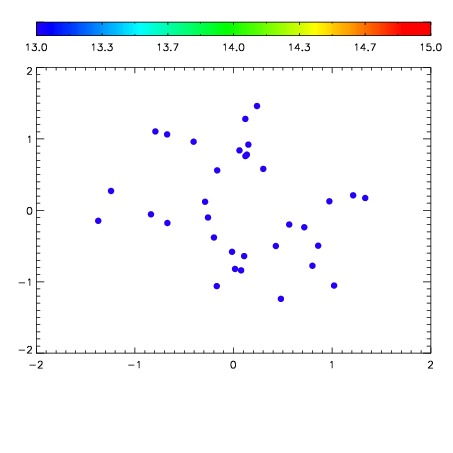

| Frame | Nreads | Zeropoints | Mag plots | Spatial mag deviation | Spatial sky 16325A emission deviations (filled: sky, open: star) | Spatial sky continuum emission | Spatial sky telluric CO2 absorption deviations (filled: H < 10) | |||||||||||||||||||||||
| 0 | 0 |
|
|
|
|
|
|
| IPAIR | NAME | SHIFT | NEWSHIFT | S/N | NAME | SHIFT | NEWSHIFT | S/N |
| 0 | 16000045 | 0.494607 | 0.00000 | 17.6996 | 16000039 | 0.00205007 | 0.492557 | 18.1076 |
| 1 | 16000037 | 0.492256 | 0.00235102 | 18.5965 | 16000043 | 0.00334490 | 0.491262 | 18.6381 |
| 2 | 16000042 | 0.493590 | 0.00101700 | 18.5885 | 16000036 | 0.00231695 | 0.492290 | 18.5477 |
| 3 | 16000034 | 0.492677 | 0.00193000 | 18.5299 | 16000035 | 0.00154973 | 0.493057 | 18.5267 |
| 4 | 16000041 | 0.492569 | 0.00203800 | 18.5278 | 16000040 | 0.00115493 | 0.493452 | 18.4989 |
| 5 | 16000030 | 0.494213 | 0.000393987 | 18.3240 | 16000031 | 0.00238876 | 0.492218 | 18.4356 |
| 6 | 16000033 | 0.492501 | 0.00210601 | 18.2821 | 16000028 | 0.00000 | 0.494607 | 18.3770 |
| 7 | 16000038 | 0.492564 | 0.00204301 | 18.1136 | 16000032 | 0.00197795 | 0.492629 | 18.3440 |
| 8 | 16000029 | 0.347320 | 0.147287 | -Inf | 16000044 | 0.00327221 | 0.491335 | 17.7269 |