| Red | Green | Blue | |
| z | 17.64 | ||
| znorm | Inf | ||
| sky | -Inf | -NaN | -Inf |
| S/N | 27.5 | 49.6 | 57.8 |
| S/N(c) | 0.0 | 0.0 | 0.0 |
| SN(E/C) |
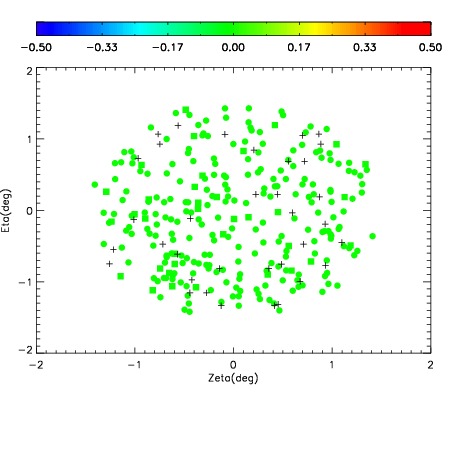

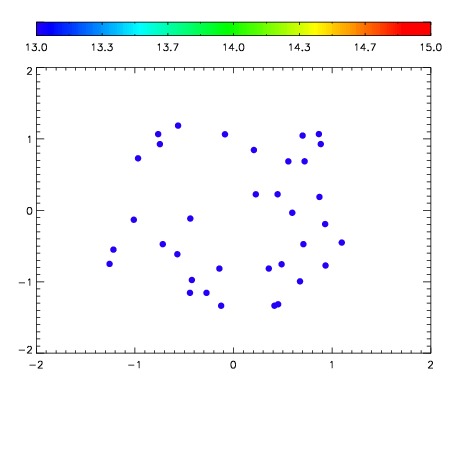

| Frame | Nreads | Zeropoints | Mag plots | Spatial mag deviation | Spatial sky 16325A emission deviations (filled: sky, open: star) | Spatial sky continuum emission | Spatial sky telluric CO2 absorption deviations (filled: H < 10) | |||||||||||||||||||||||
| 0 | 0 |
|
|
|
|
|
|
| IPAIR | NAME | SHIFT | NEWSHIFT | S/N | NAME | SHIFT | NEWSHIFT | S/N |
| 0 | 18400038 | 0.505586 | 0.00000 | 18.0821 | 18400031 | 0.00454962 | 0.501036 | 17.9683 |
| 1 | 18400041 | 0.504274 | 0.00131202 | 18.4573 | 18400040 | 0.00404167 | 0.501544 | 18.4114 |
| 2 | 18400034 | 0.504822 | 0.000764012 | 18.3974 | 18400035 | 0.00370053 | 0.501885 | 18.3843 |
| 3 | 18400042 | 0.505246 | 0.000340044 | 18.3082 | 18400043 | 0.00387352 | 0.501713 | 18.3463 |
| 4 | 18400029 | 0.503124 | 0.00246203 | 18.2967 | 18400028 | 0.00000 | 0.505586 | 18.3263 |
| 5 | 18400037 | 0.505527 | 5.90086e-05 | 18.2127 | 18400032 | 0.00452403 | 0.501062 | 18.1998 |
| 6 | 18400033 | 0.504890 | 0.000696003 | 18.1748 | 18400036 | 0.00369696 | 0.501889 | 18.1787 |
| 7 | 18400030 | 0.504463 | 0.00112301 | 18.1487 | 18400039 | 0.00518780 | 0.500398 | 18.0464 |
| 8 | 18400045 | 0.504769 | 0.000817001 | 17.9126 | 18400044 | 0.00486561 | 0.500720 | 17.9505 |