| Red | Green | Blue | |
| z | 17.64 | ||
| znorm | Inf | ||
| sky | -Inf | -Inf | -Inf |
| S/N | 19.4 | 38.3 | 38.6 |
| S/N(c) | 0.0 | 0.0 | 0.0 |
| SN(E/C) |
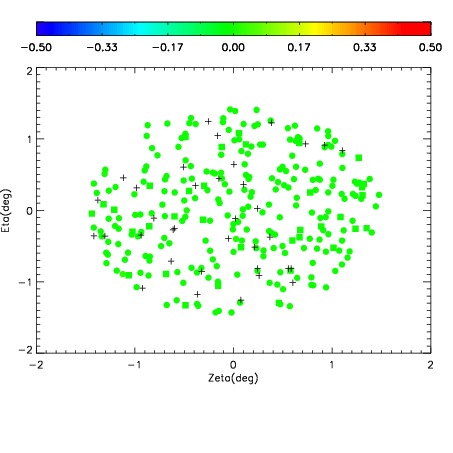
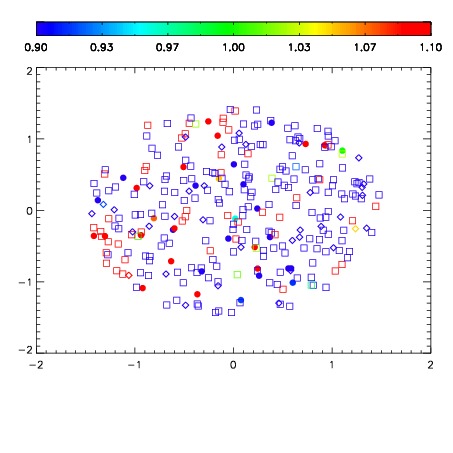
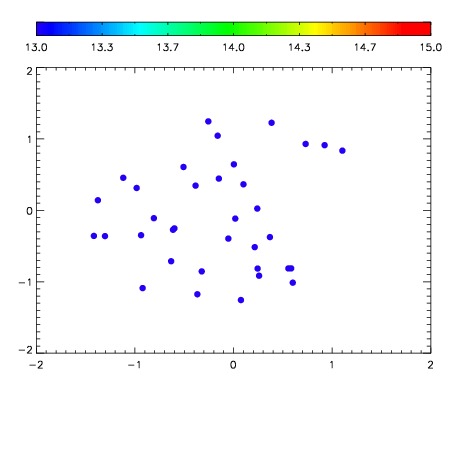

| Frame | Nreads | Zeropoints | Mag plots | Spatial mag deviation | Spatial sky 16325A emission deviations (filled: sky, open: star) | Spatial sky continuum emission | Spatial sky telluric CO2 absorption deviations (filled: H < 10) | |||||||||||||||||||||||
| 0 | 0 |
|
|
|
|
|
|
| IPAIR | NAME | SHIFT | NEWSHIFT | S/N | NAME | SHIFT | NEWSHIFT | S/N |
| 0 | 15100029 | 0.506387 | 0.00000 | 16.8256 | 15100018 | 0.000345681 | 0.506041 | 16.9266 |
| 1 | 15100032 | 0.503399 | 0.00298798 | 18.6907 | 15100031 | 0.00364413 | 0.502743 | 18.6770 |
| 2 | 15100025 | 0.504423 | 0.00196397 | 18.0218 | 15100019 | -0.000784786 | 0.507172 | 18.3718 |
| 3 | 15100020 | 0.500979 | 0.00540799 | 17.8454 | 15100030 | 0.00511121 | 0.501276 | 17.4368 |
| 4 | 15100024 | 0.503792 | 0.00259501 | 17.7675 | 15100023 | 0.00205369 | 0.504333 | 17.3896 |
| 5 | 15100028 | 0.504266 | 0.00212097 | 17.3937 | 15100026 | 0.00336616 | 0.503021 | 17.3582 |
| 6 | 15100017 | 0.500201 | 0.00618601 | 16.7489 | 15100027 | 0.00318207 | 0.503205 | 16.8761 |
| 7 | 15100021 | 0.502416 | 0.00397098 | 16.6605 | 15100022 | 0.00157766 | 0.504809 | 16.7516 |
| 8 | 15100016 | 0.499479 | 0.00690800 | 16.6468 | 15100015 | 0.00000 | 0.506387 | 16.3518 |