| Red | Green | Blue | |
| z | 17.64 | ||
| znorm | Inf | ||
| sky | -Inf | -Inf | -NaN |
| S/N | 36.0 | 67.7 | 68.6 |
| S/N(c) | 0.0 | 0.0 | 0.0 |
| SN(E/C) |

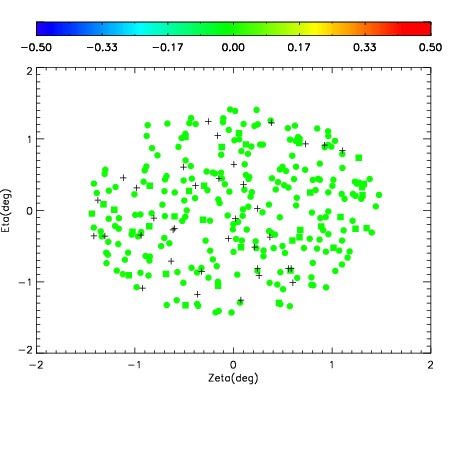
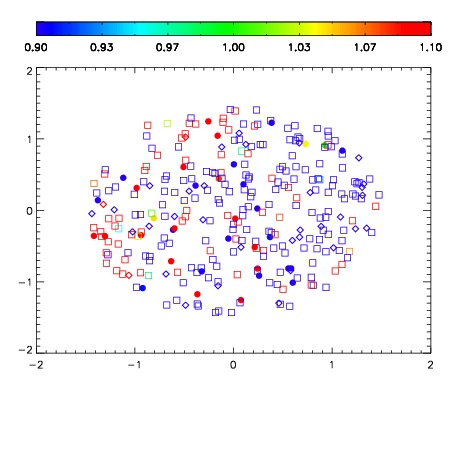


| Frame | Nreads | Zeropoints | Mag plots | Spatial mag deviation | Spatial sky 16325A emission deviations (filled: sky, open: star) | Spatial sky continuum emission | Spatial sky telluric CO2 absorption deviations (filled: H < 10) | |||||||||||||||||||||||
| 0 | 0 |
|
|
|
|
|
|
| IPAIR | NAME | SHIFT | NEWSHIFT | S/N | NAME | SHIFT | NEWSHIFT | S/N |
| 0 | 15110033 | 0.503456 | 0.00000 | 18.3648 | 15110027 | 0.00324112 | 0.500215 | 18.2047 |
| 1 | 15110021 | 0.498570 | 0.00488600 | 18.4986 | 15110015 | -0.00160916 | 0.505065 | 18.7205 |
| 2 | 15110029 | 0.501574 | 0.00188202 | 18.4771 | 15110038 | 0.00409180 | 0.499364 | 18.4554 |
| 3 | 15110016 | 0.498843 | 0.00461298 | 18.4614 | 15110030 | 0.00237417 | 0.501082 | 18.4527 |
| 4 | 15110037 | 0.502910 | 0.000545979 | 18.4533 | 15110031 | 0.00153673 | 0.501919 | 18.4484 |
| 5 | 15110036 | 0.502030 | 0.00142598 | 18.3742 | 15110034 | 0.00274597 | 0.500710 | 18.4041 |
| 6 | 15110032 | 0.501612 | 0.00184399 | 18.3650 | 15110035 | 0.00219893 | 0.501257 | 18.3613 |
| 7 | 15110028 | 0.501585 | 0.00187099 | 18.2723 | 15110026 | 0.00205179 | 0.501404 | 18.1935 |
| 8 | 15110040 | 0.501758 | 0.00169802 | 18.1099 | 15110039 | 0.00304328 | 0.500413 | 18.1689 |
| 9 | 15110024 | 0.500360 | 0.00309598 | 17.9950 | 15110023 | 0.00145315 | 0.502003 | 18.1294 |
| 10 | 15110020 | 0.499028 | 0.00442800 | 17.9046 | 15110022 | 0.000967528 | 0.502488 | 18.1210 |
| 11 | 15110025 | 0.501216 | 0.00224000 | 17.7789 | 15110014 | -0.000728181 | 0.504184 | 17.7439 |
| 12 | 15110013 | 0.499891 | 0.00356498 | 17.7618 | 15110011 | 0.00000 | 0.503456 | 17.6462 |
| 13 | 15110017 | 0.499842 | 0.00361401 | 17.5977 | 15110019 | 0.00191798 | 0.501538 | 17.3091 |
| 14 | 15110012 | 0.499574 | 0.00388199 | 17.5272 | 15110018 | 0.00109014 | 0.502366 | 17.2676 |