| Red | Green | Blue | |
| z | 17.64 | ||
| znorm | Inf | ||
| sky | -Inf | -NaN | -NaN |
| S/N | 27.4 | 44.3 | 49.6 |
| S/N(c) | 17.6 | 37.4 | 73.4 |
| SN(E/C) |
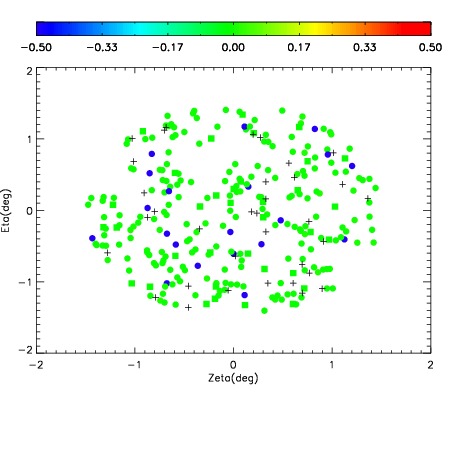
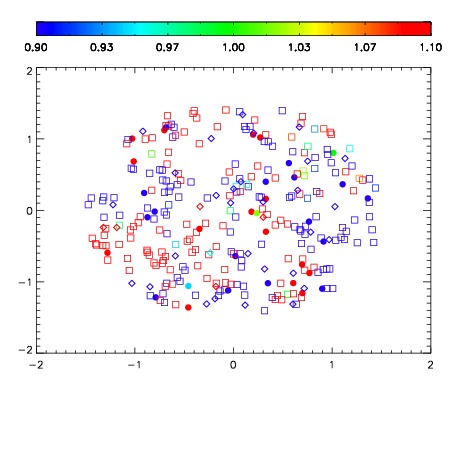


| Frame | Nreads | Zeropoints | Mag plots | Spatial mag deviation | Spatial sky 16325A emission deviations (filled: sky, open: star) | Spatial sky continuum emission | Spatial sky telluric CO2 absorption deviations (filled: H < 10) | |||||||||||||||||||||||
| 0 | 0 |
|
|
|
|
|
|
| IPAIR | NAME | SHIFT | NEWSHIFT | S/N | NAME | SHIFT | NEWSHIFT | S/N |
| 0 | 14420057 | 0.498488 | 0.00000 | 19.0064 | 14420058 | -0.00138509 | 0.499873 | 18.7276 |
| 1 | 14420056 | 0.498262 | 0.000226021 | 19.0820 | 14420055 | 0.00000 | 0.498488 | 19.0608 |
| 2 | 14420060 | 0.496503 | 0.00198501 | 17.9628 | 14420059 | -0.00174914 | 0.500237 | 18.4141 |
| 3 | 14420061 | 0.496807 | 0.00168100 | 17.9525 | 14420062 | -0.00260635 | 0.501094 | 17.5166 |
| 4 | 14420064 | 0.496487 | 0.00200102 | 15.8156 | 14420063 | -0.00244014 | 0.500928 | 17.0116 |