| Red | Green | Blue | |
| z | 17.64 | ||
| znorm | Inf | ||
| sky | -NaN | -NaN | -NaN |
| S/N | 41.0 | 65.6 | 73.9 |
| S/N(c) | 26.4 | 55.1 | 108.3 |
| SN(E/C) |
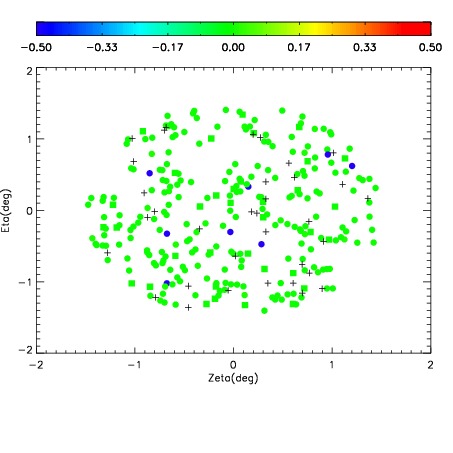
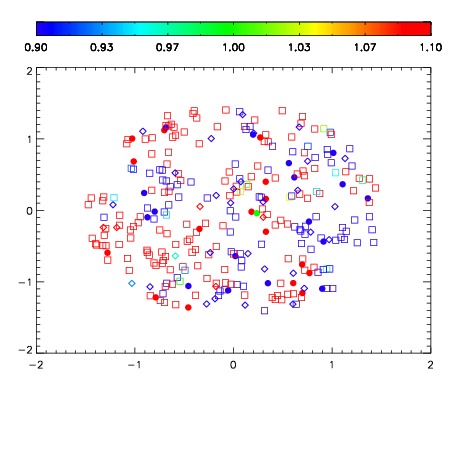
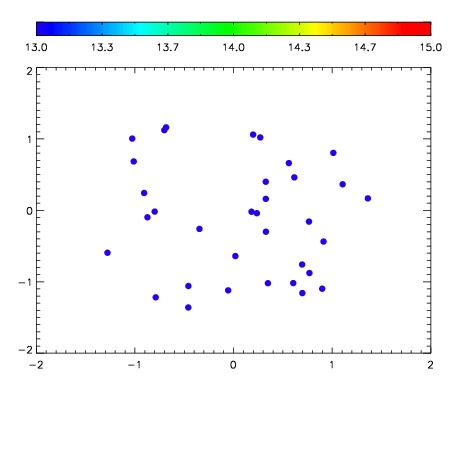

| Frame | Nreads | Zeropoints | Mag plots | Spatial mag deviation | Spatial sky 16325A emission deviations (filled: sky, open: star) | Spatial sky continuum emission | Spatial sky telluric CO2 absorption deviations (filled: H < 10) | |||||||||||||||||||||||
| 0 | 0 |
|
|
|
|
|
|
| IPAIR | NAME | SHIFT | NEWSHIFT | S/N | NAME | SHIFT | NEWSHIFT | S/N |
| 0 | 14450044 | 0.506973 | 0.00000 | 18.8751 | 14450045 | 0.00622367 | 0.500749 | 18.7262 |
| 1 | 14450036 | 0.502329 | 0.00464404 | 19.0082 | 14450041 | 0.00352020 | 0.503453 | 18.9608 |
| 2 | 14450035 | 0.501562 | 0.00541103 | 18.9937 | 14450038 | 0.00160434 | 0.505369 | 18.9444 |
| 3 | 14450040 | 0.503718 | 0.00325501 | 18.9885 | 14450037 | 0.00140151 | 0.505572 | 18.9442 |
| 4 | 14450043 | 0.506487 | 0.000486016 | 18.9444 | 14450034 | 0.00000 | 0.506973 | 18.9298 |
| 5 | 14450039 | 0.502715 | 0.00425804 | 18.9234 | 14450042 | 0.00457191 | 0.502401 | 18.8734 |