| Red | Green | Blue | |
| z | 17.64 | ||
| znorm | Inf | ||
| sky | -Inf | -Inf | -NaN |
| S/N | 24.7 | 40.1 | 43.3 |
| S/N(c) | 16.1 | 54.7 | 38.5 |
| SN(E/C) |
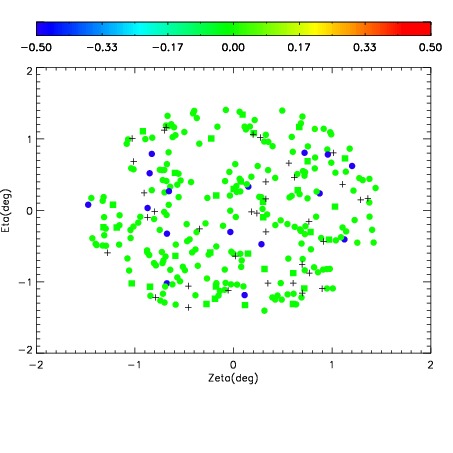
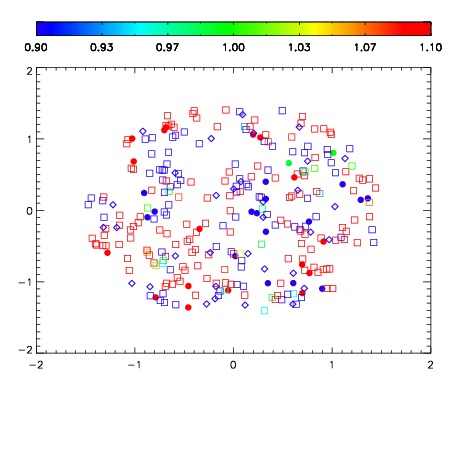


| Frame | Nreads | Zeropoints | Mag plots | Spatial mag deviation | Spatial sky 16325A emission deviations (filled: sky, open: star) | Spatial sky continuum emission | Spatial sky telluric CO2 absorption deviations (filled: H < 10) | |||||||||||||||||||||||
| 0 | 0 |
|
|
|
|
|
|
| IPAIR | NAME | SHIFT | NEWSHIFT | S/N | NAME | SHIFT | NEWSHIFT | S/N |
| 0 | 14640020 | 0.499022 | 0.00000 | 18.6638 | 14640018 | 0.00131233 | 0.497710 | 18.6513 |
| 1 | 14640016 | 0.496496 | 0.00252602 | 18.6666 | 14640015 | 0.00000 | 0.499022 | 18.8415 |
| 2 | 14640017 | 0.498259 | 0.000762999 | 18.6288 | 14640019 | 0.000880100 | 0.498142 | 18.5806 |