| Red | Green | Blue | |
| z | 17.64 | ||
| znorm | Inf | ||
| sky | -Inf | -Inf | -NaN |
| S/N | 30.2 | 48.8 | 54.2 |
| S/N(c) | 19.3 | 41.2 | 79.1 |
| SN(E/C) |
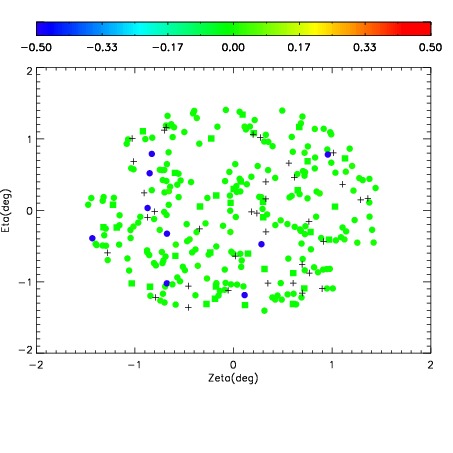
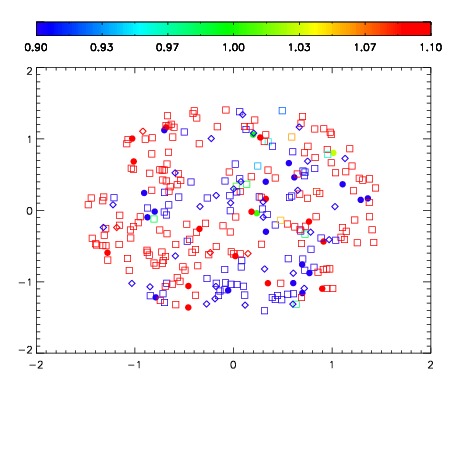
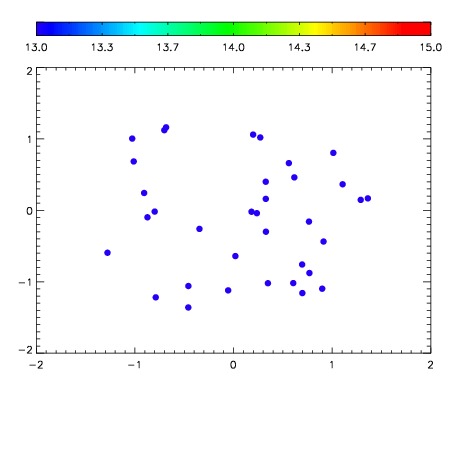

| Frame | Nreads | Zeropoints | Mag plots | Spatial mag deviation | Spatial sky 16325A emission deviations (filled: sky, open: star) | Spatial sky continuum emission | Spatial sky telluric CO2 absorption deviations (filled: H < 10) | |||||||||||||||||||||||
| 0 | 0 |
|
|
|
|
|
|
| IPAIR | NAME | SHIFT | NEWSHIFT | S/N | NAME | SHIFT | NEWSHIFT | S/N |
| 0 | 14660044 | 0.498191 | 0.00000 | 18.7524 | 14660041 | -4.10309e-05 | 0.498232 | 18.7867 |
| 1 | 14660043 | 0.496502 | 0.00168899 | 18.8048 | 14660038 | 0.00000 | 0.498191 | 18.8198 |
| 2 | 14660040 | 0.495659 | 0.00253201 | 18.7633 | 14660042 | 0.000463315 | 0.497728 | 18.8089 |
| 3 | 14660039 | 0.495223 | 0.00296801 | 18.7507 | 14660045 | 0.00197680 | 0.496214 | 18.5834 |