| Red | Green | Blue | |
| z | 17.64 | ||
| znorm | Inf | ||
| sky | -Inf | -Inf | -NaN |
| S/N | 32.2 | 50.8 | 55.4 |
| S/N(c) | 20.5 | 43.7 | 85.4 |
| SN(E/C) |


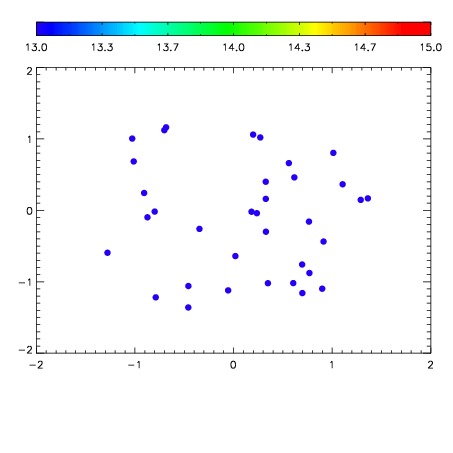

| Frame | Nreads | Zeropoints | Mag plots | Spatial mag deviation | Spatial sky 16325A emission deviations (filled: sky, open: star) | Spatial sky continuum emission | Spatial sky telluric CO2 absorption deviations (filled: H < 10) | |||||||||||||||||||||||
| 0 | 0 |
|
|
|
|
|
|
| IPAIR | NAME | SHIFT | NEWSHIFT | S/N | NAME | SHIFT | NEWSHIFT | S/N |
| 0 | 14960076 | 0.501506 | 0.00000 | 18.6147 | 14960077 | -0.000217104 | 0.501723 | 18.7084 |
| 1 | 14960071 | 0.500380 | 0.00112599 | 18.9634 | 14960070 | 0.00000 | 0.501506 | 18.9507 |
| 2 | 14960072 | 0.500889 | 0.000616968 | 18.8412 | 14960073 | -0.00118317 | 0.502689 | 18.8999 |
| 3 | 14960075 | 0.500693 | 0.000812948 | 18.7471 | 14960074 | -0.000694047 | 0.502200 | 18.8741 |