| Red | Green | Blue | |
| z | 17.64 | ||
| znorm | Inf | ||
| sky | -Inf | -Inf | -NaN |
| S/N | 23.0 | 39.6 | 43.8 |
| S/N(c) | 17.0 | 0.4 | 70.1 |
| SN(E/C) |
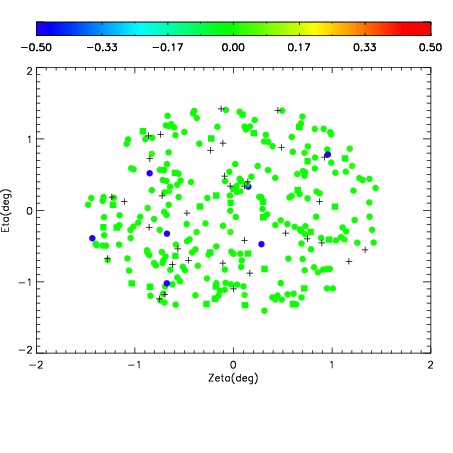
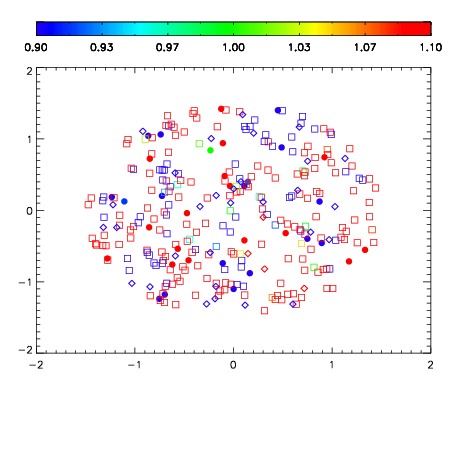
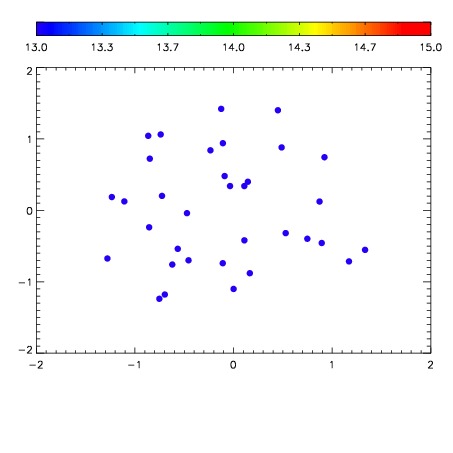

| Frame | Nreads | Zeropoints | Mag plots | Spatial mag deviation | Spatial sky 16325A emission deviations (filled: sky, open: star) | Spatial sky continuum emission | Spatial sky telluric CO2 absorption deviations (filled: H < 10) | |||||||||||||||||||||||
| 0 | 0 |
|
|
|
|
|
|
| IPAIR | NAME | SHIFT | NEWSHIFT | S/N | NAME | SHIFT | NEWSHIFT | S/N |
| 0 | 14440077 | 0.501746 | 0.00000 | 18.2581 | 14440078 | 0.000771879 | 0.500974 | 18.4415 |
| 1 | 14440072 | 0.499239 | 0.00250700 | 18.6814 | 14440074 | 8.80588e-05 | 0.501658 | 18.6572 |
| 2 | 14440073 | 0.499522 | 0.00222400 | 18.6543 | 14440075 | -0.000202530 | 0.501949 | 18.5757 |
| 3 | 14440076 | 0.501103 | 0.000643015 | 18.0853 | 14440071 | 0.00000 | 0.501746 | 18.3518 |