| Red | Green | Blue | |
| z | 17.64 | ||
| znorm | Inf | ||
| sky | -Inf | -Inf | -NaN |
| S/N | 34.7 | 55.2 | 60.4 |
| S/N(c) | 23.1 | 49.2 | 92.5 |
| SN(E/C) |
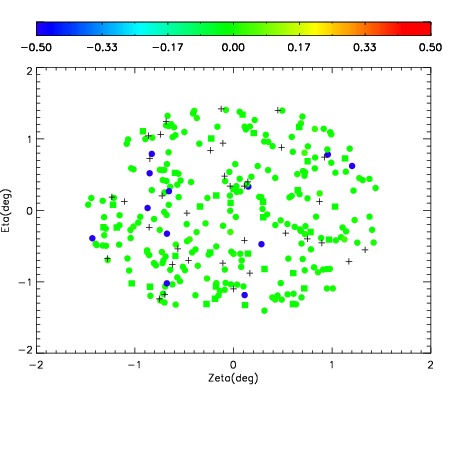
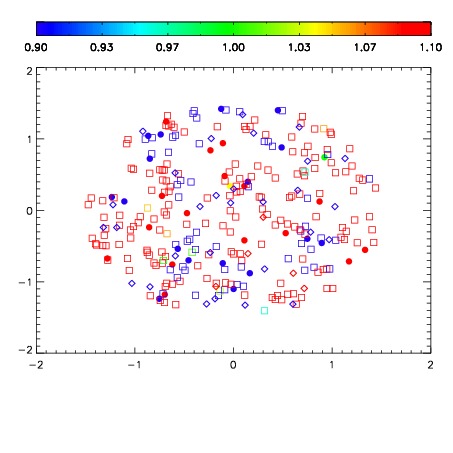


| Frame | Nreads | Zeropoints | Mag plots | Spatial mag deviation | Spatial sky 16325A emission deviations (filled: sky, open: star) | Spatial sky continuum emission | Spatial sky telluric CO2 absorption deviations (filled: H < 10) | |||||||||||||||||||||||
| 0 | 0 |
|
|
|
|
|
|
| IPAIR | NAME | SHIFT | NEWSHIFT | S/N | NAME | SHIFT | NEWSHIFT | S/N |
| 0 | 14670079 | 0.500263 | 0.00000 | 19.0761 | 14670084 | -0.000551296 | 0.500814 | 19.0736 |
| 1 | 14670078 | 0.499414 | 0.000848979 | 19.0873 | 14670081 | -0.00156140 | 0.501824 | 19.1120 |
| 2 | 14670083 | 0.499992 | 0.000270963 | 19.0811 | 14670077 | 0.00000 | 0.500263 | 19.0798 |
| 3 | 14670082 | 0.498952 | 0.00131097 | 19.0224 | 14670080 | -0.00113947 | 0.501402 | 19.0726 |