| Red | Green | Blue | |
| z | 17.64 | ||
| znorm | Inf | ||
| sky | -Inf | -Inf | -Inf |
| S/N | 29.3 | 48.2 | 54.4 |
| S/N(c) | 19.1 | 63.9 | 30.7 |
| SN(E/C) |


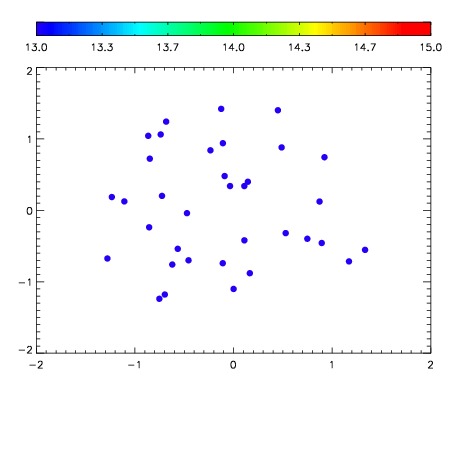

| Frame | Nreads | Zeropoints | Mag plots | Spatial mag deviation | Spatial sky 16325A emission deviations (filled: sky, open: star) | Spatial sky continuum emission | Spatial sky telluric CO2 absorption deviations (filled: H < 10) | |||||||||||||||||||||||
| 0 | 0 |
|
|
|
|
|
|
| IPAIR | NAME | SHIFT | NEWSHIFT | S/N | NAME | SHIFT | NEWSHIFT | S/N |
| 0 | 14940088 | 0.500551 | 0.00000 | 18.7836 | 14940085 | 0.000191275 | 0.500360 | 18.8018 |
| 1 | 14940087 | 0.499931 | 0.000619978 | 18.7732 | 14940086 | 0.000351629 | 0.500199 | 18.7669 |
| 2 | 14940084 | 0.500350 | 0.000200987 | 18.7540 | 14940082 | 0.00000 | 0.500551 | 18.7296 |
| 3 | 14940083 | 0.499736 | 0.000814974 | 18.7183 | 14940089 | -0.000260336 | 0.500811 | 18.6487 |