| Red | Green | Blue | |
| z | 17.64 | ||
| znorm | Inf | ||
| sky | -Inf | -Inf | -Inf |
| S/N | 34.6 | 55.0 | 61.6 |
| S/N(c) | 23.3 | 82.1 | 27.3 |
| SN(E/C) |


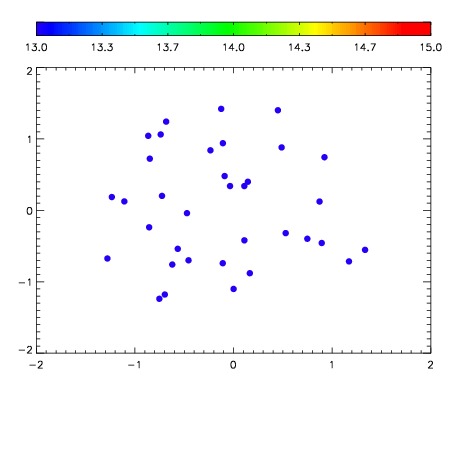

| Frame | Nreads | Zeropoints | Mag plots | Spatial mag deviation | Spatial sky 16325A emission deviations (filled: sky, open: star) | Spatial sky continuum emission | Spatial sky telluric CO2 absorption deviations (filled: H < 10) | |||||||||||||||||||||||
| 0 | 0 |
|
|
|
|
|
|
| IPAIR | NAME | SHIFT | NEWSHIFT | S/N | NAME | SHIFT | NEWSHIFT | S/N |
| 0 | 15000050 | 0.499361 | 0.00000 | 18.9885 | 15000051 | 0.00172829 | 0.497633 | 19.0578 |
| 1 | 15000045 | 0.497701 | 0.00166002 | 19.1296 | 15000047 | 0.00145759 | 0.497903 | 19.1411 |
| 2 | 15000046 | 0.498435 | 0.000926018 | 19.1239 | 15000044 | 0.00000 | 0.499361 | 19.1306 |
| 3 | 15000049 | 0.497509 | 0.00185201 | 19.0977 | 15000048 | 0.00181547 | 0.497546 | 19.1007 |