| Red | Green | Blue | |
| z | 17.65 | ||
| znorm | Inf | ||
| sky | -Inf | -Inf | -Inf |
| S/N | 16.0 | 27.3 | 30.0 |
| S/N(c) | 11.6 | 41.2 | 13.6 |
| SN(E/C) |

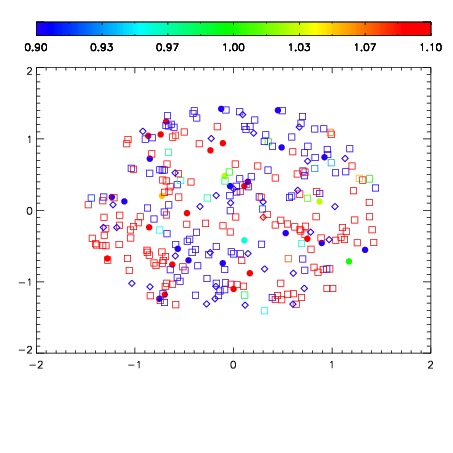


| Frame | Nreads | Zeropoints | Mag plots | Spatial mag deviation | Spatial sky 16325A emission deviations (filled: sky, open: star) | Spatial sky continuum emission | Spatial sky telluric CO2 absorption deviations (filled: H < 10) | |||||||||||||||||||||||
| 0 | 0 |
|
|
|
|
|
|
| IPAIR | NAME | SHIFT | NEWSHIFT | S/N | NAME | SHIFT | NEWSHIFT | S/N |
| 0 | 15190035 | 0.000467647 | 0.00000 | 18.4393 | 15190034 | -0.508496 | 0.508964 | 18.3984 |
| 1 | 15190032 | 0.00000 | 0.000467647 | 18.4016 | 15190033 | -0.508116 | 0.508584 | 18.3313 |