| Red | Green | Blue | |
| z | 17.64 | ||
| znorm | Inf | ||
| sky | -Inf | -NaN | -NaN |
| S/N | 35.0 | 55.2 | 61.7 |
| S/N(c) | 22.5 | 44.6 | 35.1 |
| SN(E/C) |
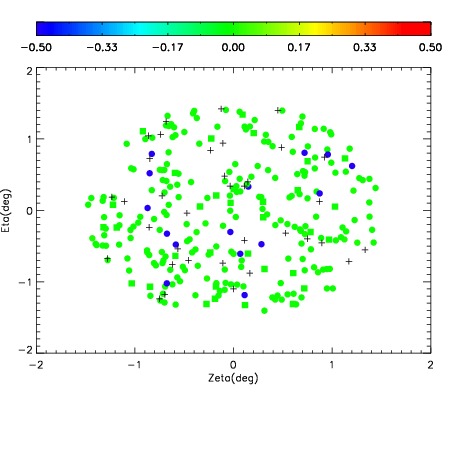
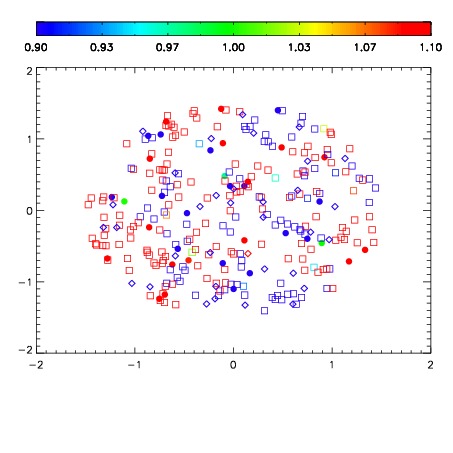
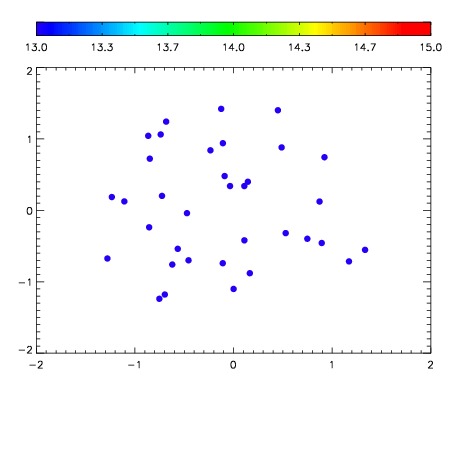

| Frame | Nreads | Zeropoints | Mag plots | Spatial mag deviation | Spatial sky 16325A emission deviations (filled: sky, open: star) | Spatial sky continuum emission | Spatial sky telluric CO2 absorption deviations (filled: H < 10) | |||||||||||||||||||||||
| 0 | 0 |
|
|
|
|
|
|
| IPAIR | NAME | SHIFT | NEWSHIFT | S/N | NAME | SHIFT | NEWSHIFT | S/N |
| 0 | 15290024 | 0.504878 | 0.00000 | 18.9812 | 15290025 | 0.000598239 | 0.504280 | 19.0065 |
| 1 | 15290028 | 0.504650 | 0.000227988 | 19.0538 | 15290022 | 0.00000 | 0.504878 | 19.0412 |
| 2 | 15290027 | 0.503626 | 0.00125200 | 18.9873 | 15290029 | 0.000711987 | 0.504166 | 19.0410 |
| 3 | 15290023 | 0.504237 | 0.000640988 | 18.9758 | 15290026 | 0.000587448 | 0.504291 | 18.9967 |