| Red | Green | Blue | |
| z | 17.64 | ||
| znorm | Inf | ||
| sky | -Inf | -Inf | -NaN |
| S/N | 20.0 | 34.4 | 38.7 |
| S/N(c) | 12.6 | 0.3 | 38.4 |
| SN(E/C) |
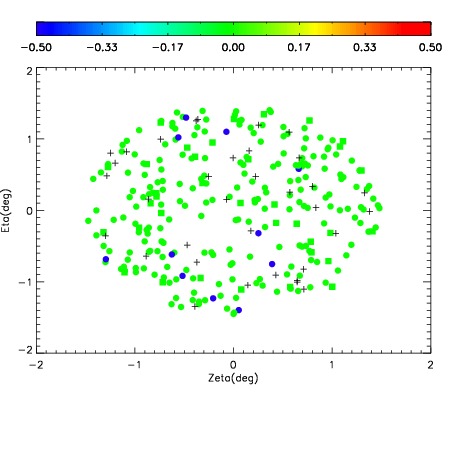
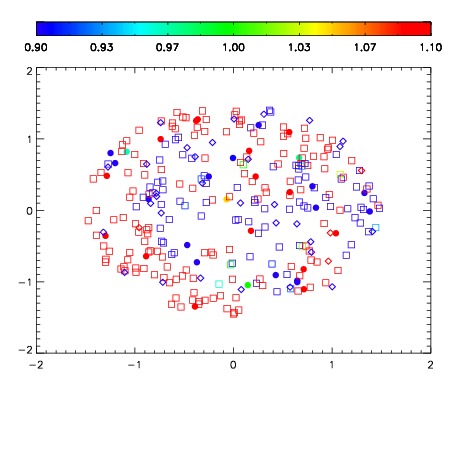


| Frame | Nreads | Zeropoints | Mag plots | Spatial mag deviation | Spatial sky 16325A emission deviations (filled: sky, open: star) | Spatial sky continuum emission | Spatial sky telluric CO2 absorption deviations (filled: H < 10) | |||||||||||||||||||||||
| 0 | 0 |
|
|
|
|
|
|
| IPAIR | NAME | SHIFT | NEWSHIFT | S/N | NAME | SHIFT | NEWSHIFT | S/N |
| 0 | 14410048 | 0.498136 | 0.00000 | 19.0420 | 14410049 | 0.000133428 | 0.498003 | 19.0107 |
| 1 | 14410047 | 0.497568 | 0.000568002 | 19.0304 | 14410046 | 0.00000 | 0.498136 | 18.8801 |