| Red | Green | Blue | |
| z | 17.64 | ||
| znorm | Inf | ||
| sky | -Inf | -Inf | -Inf |
| S/N | 21.7 | 38.4 | 42.7 |
| S/N(c) | 15.3 | 54.9 | 52.1 |
| SN(E/C) |
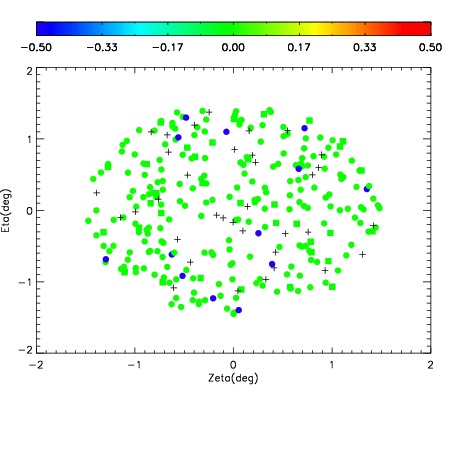
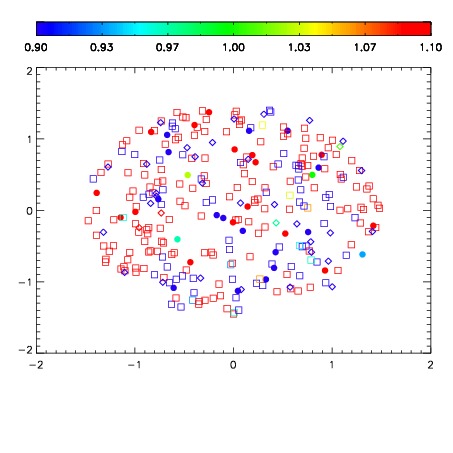


| Frame | Nreads | Zeropoints | Mag plots | Spatial mag deviation | Spatial sky 16325A emission deviations (filled: sky, open: star) | Spatial sky continuum emission | Spatial sky telluric CO2 absorption deviations (filled: H < 10) | |||||||||||||||||||||||
| 0 | 0 |
|
|
|
|
|
|
| IPAIR | NAME | SHIFT | NEWSHIFT | S/N | NAME | SHIFT | NEWSHIFT | S/N |
| 0 | 14670104 | 0.500924 | 0.00000 | 18.7350 | 14670103 | 0.000164858 | 0.500759 | 18.7265 |
| 1 | 14670100 | 0.499816 | 0.00110799 | 18.9159 | 14670099 | 0.00000 | 0.500924 | 18.9381 |
| 2 | 14670101 | 0.500552 | 0.000371993 | 18.8415 | 14670102 | -0.000322956 | 0.501247 | 18.7575 |