| Red | Green | Blue | |
| z | 17.65 | ||
| znorm | Inf | ||
| sky | -Inf | -Inf | -Inf |
| S/N | 19.7 | 33.7 | 38.7 |
| S/N(c) | 27.4 | 54.6 | 52.5 |
| SN(E/C) |
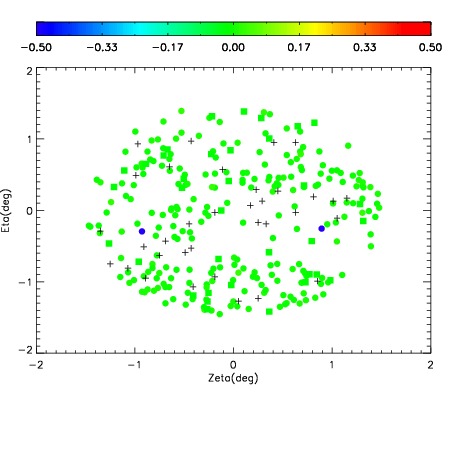
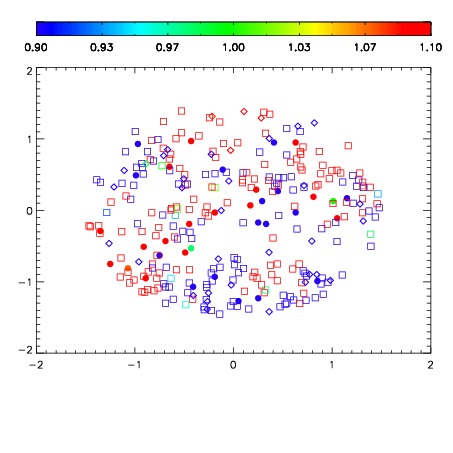
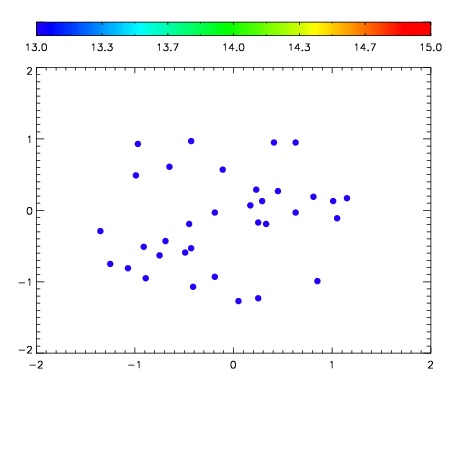

| Frame | Nreads | Zeropoints | Mag plots | Spatial mag deviation | Spatial sky 16325A emission deviations (filled: sky, open: star) | Spatial sky continuum emission | Spatial sky telluric CO2 absorption deviations (filled: H < 10) | |||||||||||||||||||||||
| 0 | 0 |
|
|
|
|
|
|
| IPAIR | NAME | SHIFT | NEWSHIFT | S/N | NAME | SHIFT | NEWSHIFT | S/N |
| 0 | 18500060 | 0.00344422 | 0.00000 | 18.1627 | 18500054 | -0.502156 | 0.505600 | 18.0979 |
| 1 | 18500053 | 0.00000 | 0.00344422 | 18.3918 | 18500058 | -0.502886 | 0.506330 | 18.3205 |
| 2 | 18500057 | 0.00146357 | 0.00198065 | 18.3068 | 18500055 | -0.502091 | 0.505535 | 18.2794 |
| 3 | 18500056 | 0.000483293 | 0.00296093 | 18.2019 | 18500059 | -0.502432 | 0.505876 | 18.2752 |