| Red | Green | Blue | |
| z | 17.65 | ||
| znorm | Inf | ||
| sky | -Inf | -Inf | -Inf |
| S/N | 26.5 | 43.3 | 52.5 |
| S/N(c) | 44.4 | 17.1 | 65.2 |
| SN(E/C) |
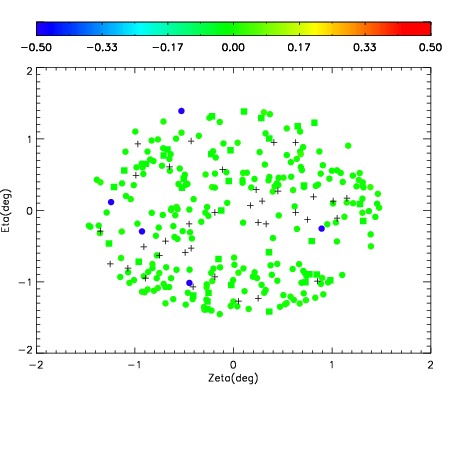
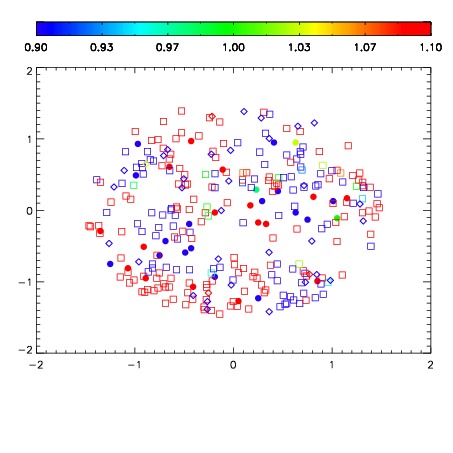
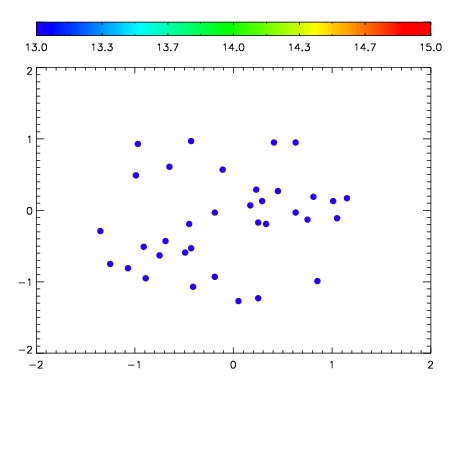

| Frame | Nreads | Zeropoints | Mag plots | Spatial mag deviation | Spatial sky 16325A emission deviations (filled: sky, open: star) | Spatial sky continuum emission | Spatial sky telluric CO2 absorption deviations (filled: H < 10) | |||||||||||||||||||||||
| 0 | 0 |
|
|
|
|
|
|
| IPAIR | NAME | SHIFT | NEWSHIFT | S/N | NAME | SHIFT | NEWSHIFT | S/N |
| 0 | 18560063 | 0.496238 | 0.00000 | 18.6756 | 18560057 | 0.00000 | 0.496238 | 18.7262 |
| 1 | 18560059 | 0.495862 | 0.000375986 | 18.7347 | 18560061 | 0.000968722 | 0.495269 | 18.7879 |
| 2 | 18560062 | 0.496068 | 0.000169992 | 18.7217 | 18560060 | 0.00126561 | 0.494972 | 18.7274 |
| 3 | 18560058 | 0.495170 | 0.00106800 | 18.7039 | 18560064 | 0.000720878 | 0.495517 | 18.7262 |