| Red | Green | Blue | |
| z | 17.64 | ||
| znorm | Inf | ||
| sky | -Inf | -Inf | -Inf |
| S/N | 28.2 | 45.2 | 53.7 |
| S/N(c) | 44.7 | 17.5 | 63.3 |
| SN(E/C) |
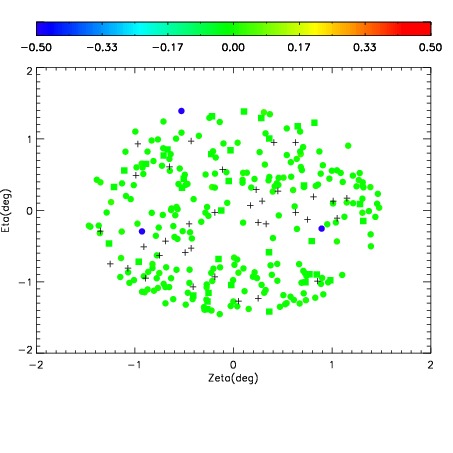
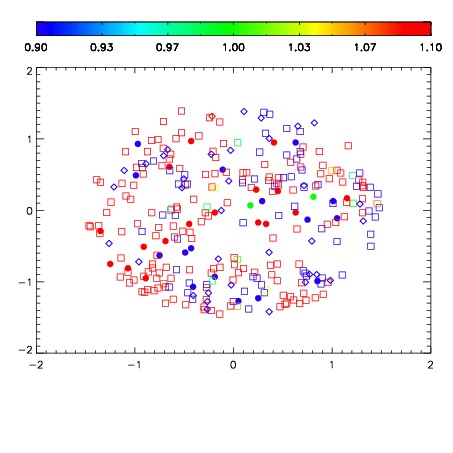
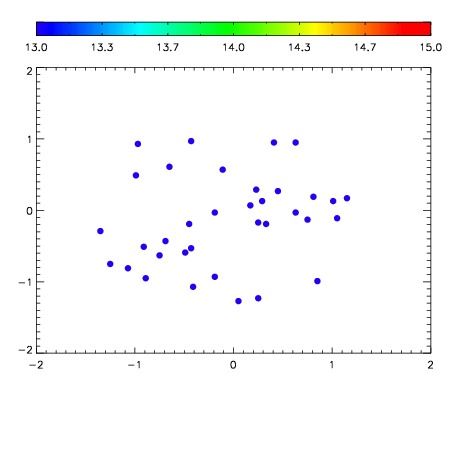

| Frame | Nreads | Zeropoints | Mag plots | Spatial mag deviation | Spatial sky 16325A emission deviations (filled: sky, open: star) | Spatial sky continuum emission | Spatial sky telluric CO2 absorption deviations (filled: H < 10) | |||||||||||||||||||||||
| 0 | 0 |
|
|
|
|
|
|
| IPAIR | NAME | SHIFT | NEWSHIFT | S/N | NAME | SHIFT | NEWSHIFT | S/N |
| 0 | 18780062 | 0.00000 | 0.00000 | 18.3590 | 18780063 | -0.506315 | 0.506315 | 18.5108 |
| 1 | 18780069 | -0.000699497 | 0.000699497 | 18.7135 | 18780068 | -0.507195 | 0.507195 | 18.6973 |
| 2 | 18780066 | -5.39983e-05 | 5.39983e-05 | 18.6597 | 18780071 | -0.506329 | 0.506329 | 18.6353 |
| 3 | 18780070 | -0.000624595 | 0.000624595 | 18.6496 | 18780067 | -0.506868 | 0.506868 | 18.6179 |
| 4 | 18780065 | -0.000378574 | 0.000378574 | 18.6101 | 18780064 | -0.506569 | 0.506569 | 18.5884 |