| Red | Green | Blue | |
| z | 17.65 | ||
| znorm | Inf | ||
| sky | -Inf | -Inf | -Inf |
| S/N | 38.1 | 57.1 | 67.5 |
| S/N(c) | 37.5 | 62.0 | 57.8 |
| SN(E/C) |
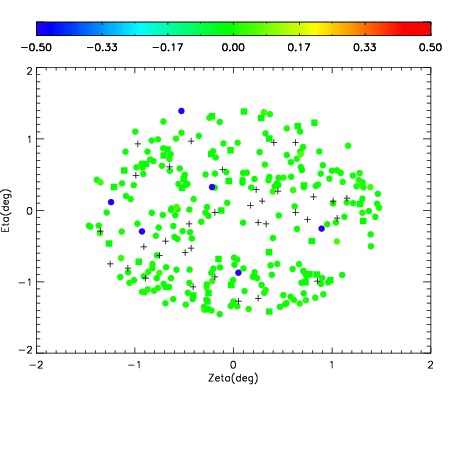
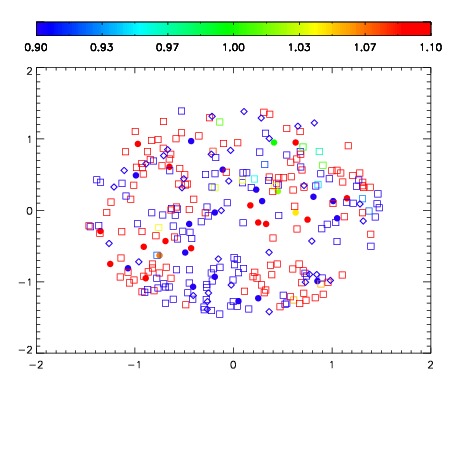
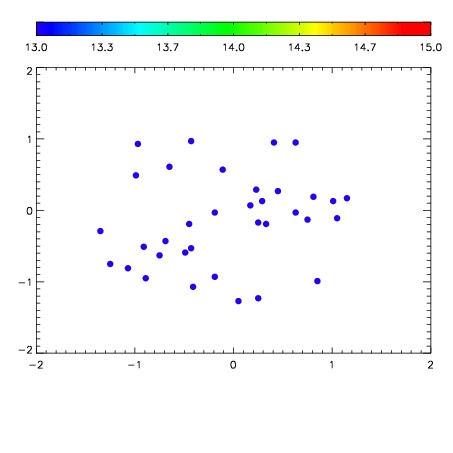

| Frame | Nreads | Zeropoints | Mag plots | Spatial mag deviation | Spatial sky 16325A emission deviations (filled: sky, open: star) | Spatial sky continuum emission | Spatial sky telluric CO2 absorption deviations (filled: H < 10) | |||||||||||||||||||||||
| 0 | 0 |
|
|
|
|
|
|
| IPAIR | NAME | SHIFT | NEWSHIFT | S/N | NAME | SHIFT | NEWSHIFT | S/N |
| 0 | 18820073 | 0.504427 | 0.00000 | 19.7833 | 18820074 | 0.00139362 | 0.503033 | 19.7301 |
| 1 | 18820072 | 0.503832 | 0.000595033 | 19.7955 | 18820071 | 0.00000 | 0.504427 | 19.7940 |
| 2 | 18820076 | 0.500891 | 0.00353605 | 18.9327 | 18820075 | 0.00159492 | 0.502832 | 18.9933 |