| Frame | Nreads | Zeropoints | Mag plots
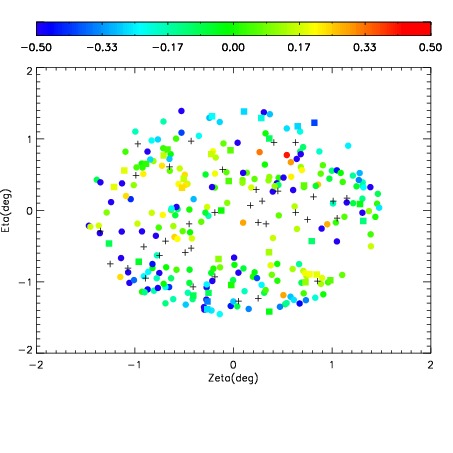
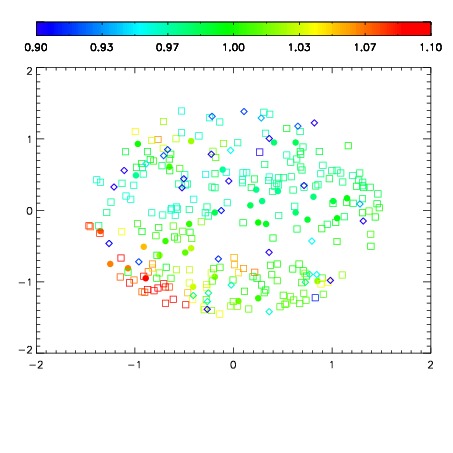
| Spatial mag deviation
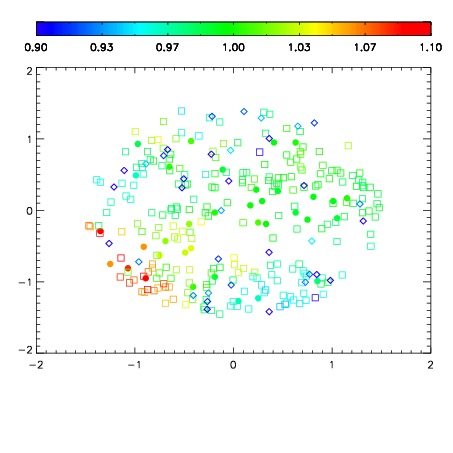
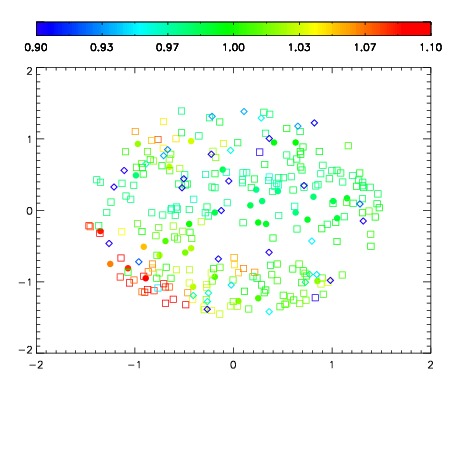
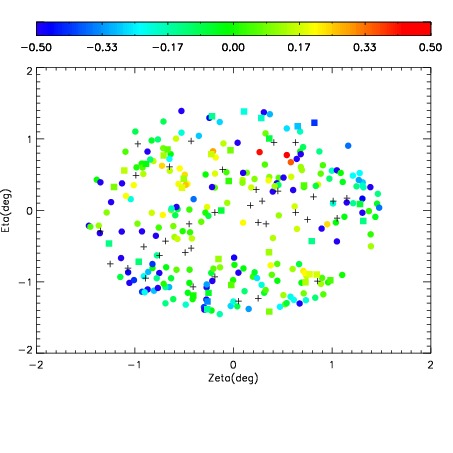
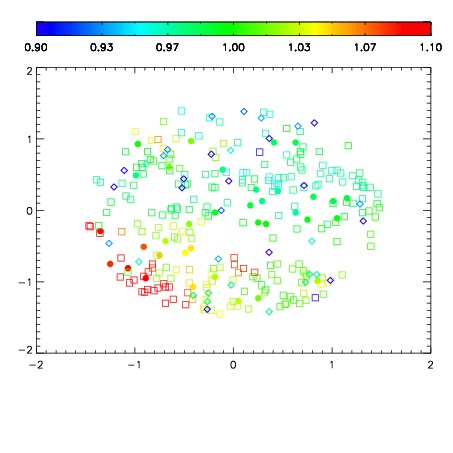
| Spatial sky 16325A emission deviations (filled: sky, open: star)
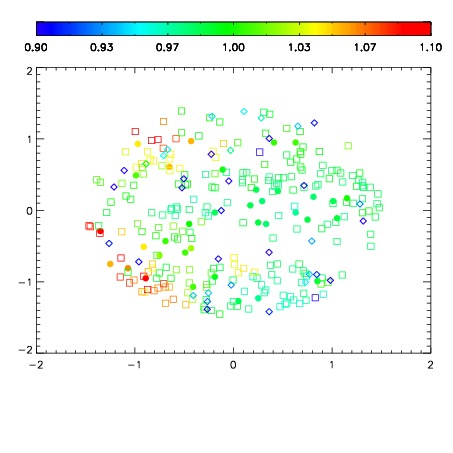
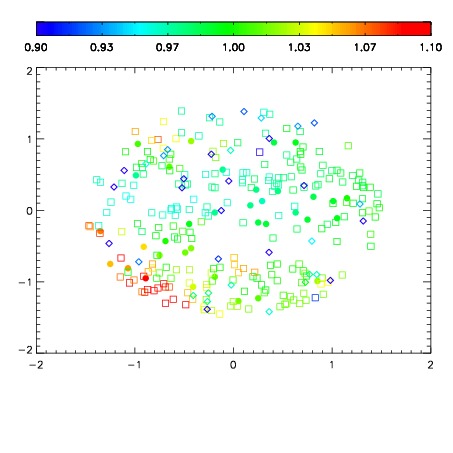
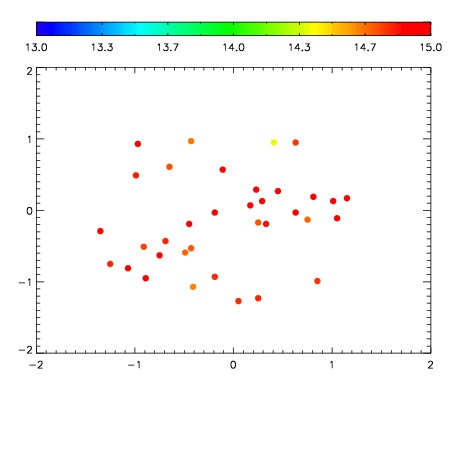
| Spatial sky continuum emission
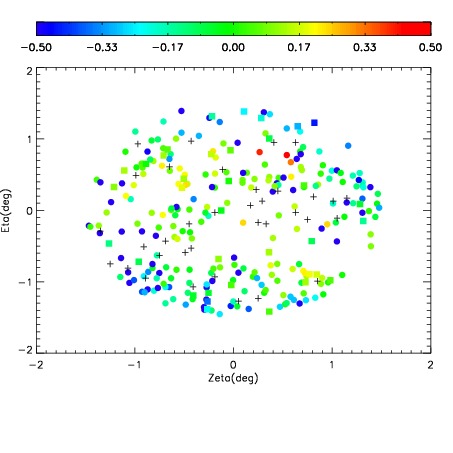
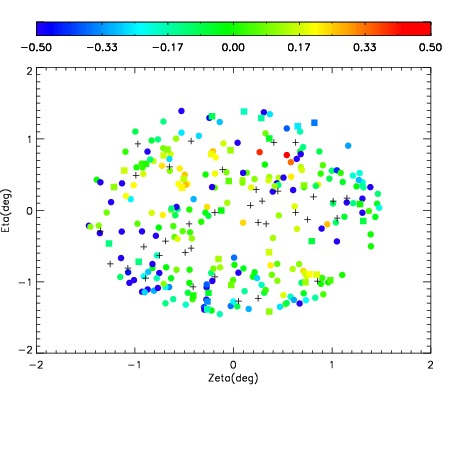
| Spatial sky telluric CO2 absorption deviations (filled: H < 10)
|
| 18850028
| 47
| | Red | Green | Blue
| | z | | 18.68
| | znorm | | 14.50
| | sky | 15.0 | 14.9 | 15.2
| | S/N | 14.0 | 21.6 | 25.2
| | S/N(c) | 5.7 | 26.6 | 27.8
| | SN(E/C) 0.40
|
| 
| 
| 
| 
| 
|
| 18850029
| 47
| | Red | Green | Blue
| | z | | 18.80
| | znorm | | 14.62
| | sky | 15.1 | 15.0 | 15.2
| | S/N | 15.4 | 23.7 | 27.9
| | S/N(c) | 6.0 | 28.0 | 29.3
| | SN(E/C) 0.36
|
| 
| 
| 
| 
| 
|
| 18850030
| 47
| | Red | Green | Blue
| | z | | 18.90
| | znorm | | 14.72
| | sky | 15.0 | 15.1 | 15.3
| | S/N | 16.2 | 24.8 | 29.3
| | S/N(c) | 6.1 | 28.6 | 29.8
| | SN(E/C) 0.35
|
| 
| 
| 
| 
| 
|
| 18850031
| 47
| | Red | Green | Blue
| | z | | 18.95
| | znorm | | 14.77
| | sky | 15.0 | 15.0 | 15.0
| | S/N | 16.9 | 25.5 | 29.8
| | S/N(c) | 6.2 | 29.2 | 30.5
| | SN(E/C) 0.36
|
| 
| 
| 
| 
| 
|
| 18850032
| 47
| | Red | Green | Blue
| | z | | 19.03
| | znorm | | 14.85
| | sky | 14.8 | 15.1 | 15.1
| | S/N | 17.4 | 26.4 | 30.9
| | S/N(c) | 6.3 | 29.5 | 30.8
| | SN(E/C) 0.35
|
| 
| 
| 
| 
| 
|
| 18850033
| 47
| | Red | Green | Blue
| | z | | 19.04
| | znorm | | 14.86
| | sky | 15.0 | 15.0 | 15.1
| | S/N | 17.6 | 27.2 | 31.8
| | S/N(c) | 6.5 | 30.6 | 32.1
| | SN(E/C) 0.35
|
| 
| 
| 
| 
| 
|
| 18850034
| 47
| | Red | Green | Blue
| | z | | 19.02
| | znorm | | 14.84
| | sky | 15.3 | 15.2 | 15.0
| | S/N | 17.3 | 27.1 | 31.8
| | S/N(c) | 6.6 | 30.8 | 32.2
| | SN(E/C) 0.34
|
| 
| 
| 
| 
| 
|
| 18850035
| 47
| | Red | Green | Blue
| | z | | 18.99
| | znorm | | 14.81
| | sky | 15.0 | 14.9 | 14.9
| | S/N | 17.3 | 26.5 | 31.4
| | S/N(c) | 6.7 | 31.1 | 32.7
| | SN(E/C) 0.36
|
| 
| 
| 
| 
| 
|