| Red | Green | Blue | |
| z | 17.65 | ||
| znorm | Inf | ||
| sky | -Inf | -Inf | -Inf |
| S/N | 30.5 | 48.4 | 57.2 |
| S/N(c) | 12.5 | 58.6 | 61.4 |
| SN(E/C) |
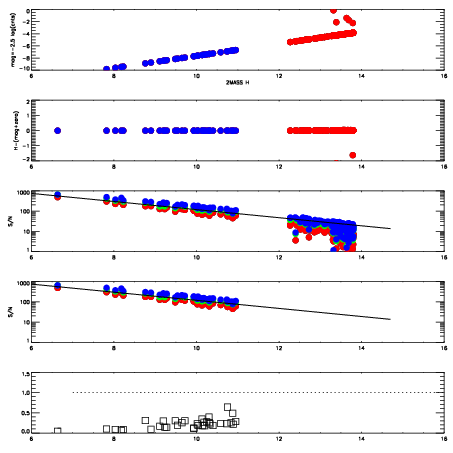
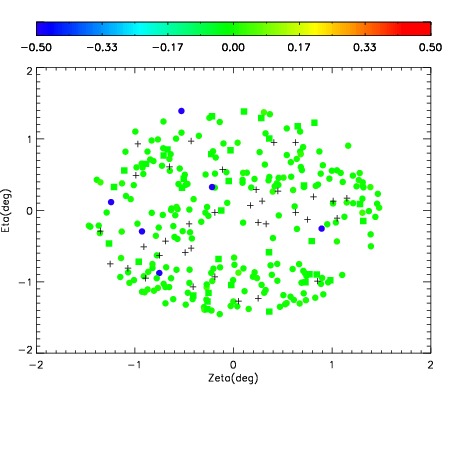
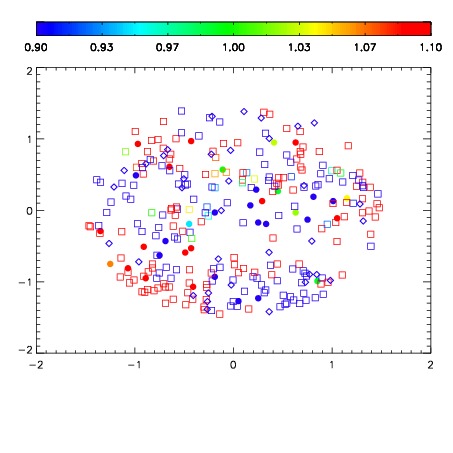
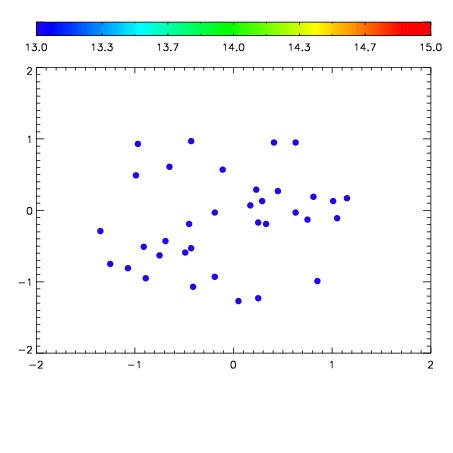

| Frame | Nreads | Zeropoints | Mag plots | Spatial mag deviation | Spatial sky 16325A emission deviations (filled: sky, open: star) | Spatial sky continuum emission | Spatial sky telluric CO2 absorption deviations (filled: H < 10) | |||||||||||||||||||||||
| 0 | 0 |
|
|
|
|
|
|
| IPAIR | NAME | SHIFT | NEWSHIFT | S/N | NAME | SHIFT | NEWSHIFT | S/N |
| 0 | 18850032 | 0.00132506 | 0.00000 | 18.9985 | 18850033 | -0.506685 | 0.508010 | 18.9897 |
| 1 | 18850035 | 0.000835280 | 0.000489780 | 18.9539 | 18850034 | -0.506505 | 0.507830 | 18.9836 |
| 2 | 18850031 | 0.000796622 | 0.000528438 | 18.9069 | 18850030 | -0.508665 | 0.509990 | 18.8502 |
| 3 | 18850028 | 0.00000 | 0.00132506 | 18.6531 | 18850029 | -0.508578 | 0.509903 | 18.7730 |