| Red | Green | Blue | |
| z | 17.64 | ||
| znorm | Inf | ||
| sky | -Inf | -NaN | -Inf |
| S/N | 29.6 | 48.4 | 50.9 |
| S/N(c) | 16.4 | 74.2 | 14.3 |
| SN(E/C) |
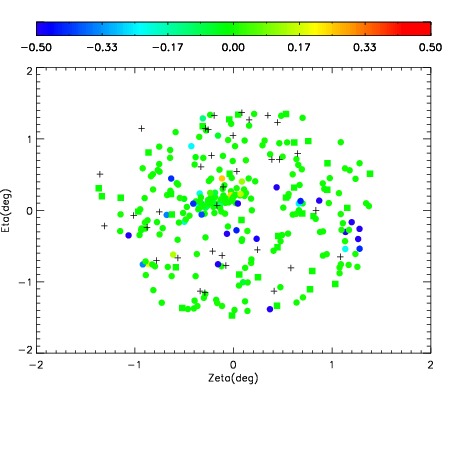
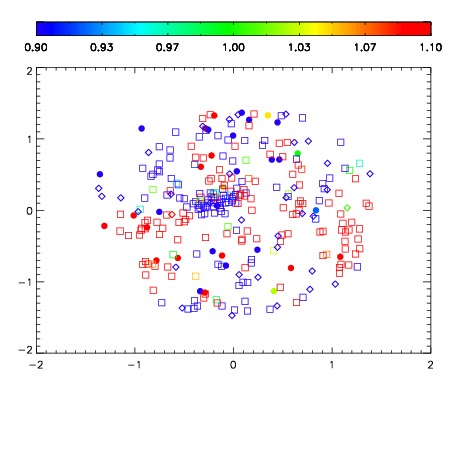


| Frame | Nreads | Zeropoints | Mag plots | Spatial mag deviation | Spatial sky 16325A emission deviations (filled: sky, open: star) | Spatial sky continuum emission | Spatial sky telluric CO2 absorption deviations (filled: H < 10) | |||||||||||||||||||||||
| 0 | 0 |
|
|
|
|
|
|
| IPAIR | NAME | SHIFT | NEWSHIFT | S/N | NAME | SHIFT | NEWSHIFT | S/N |
| 0 | 14650112 | 0.495948 | 0.00000 | 19.0481 | 14650110 | 0.00149759 | 0.494450 | 19.0537 |
| 1 | 14650108 | 0.493058 | 0.00288999 | 19.0885 | 14650107 | 0.00000 | 0.495948 | 19.0849 |
| 2 | 14650109 | 0.494248 | 0.00169998 | 19.0450 | 14650111 | 0.00185993 | 0.494088 | 19.0292 |