| Red | Green | Blue | |
| z | 17.65 | ||
| znorm | Inf | ||
| sky | -Inf | -NaN | -NaN |
| S/N | 35.6 | 57.9 | 60.1 |
| S/N(c) | 64.6 | 16.1 | 67.4 |
| SN(E/C) |
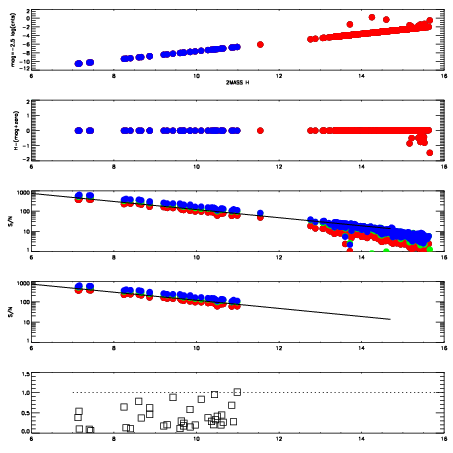


| Frame | Nreads | Zeropoints | Mag plots | Spatial mag deviation | Spatial sky 16325A emission deviations (filled: sky, open: star) | Spatial sky continuum emission | Spatial sky telluric CO2 absorption deviations (filled: H < 10) | |||||||||||||||||||||||
| 0 | 0 |
|
|
|
|
|
|
| IPAIR | NAME | SHIFT | NEWSHIFT | S/N | NAME | SHIFT | NEWSHIFT | S/N |
| 0 | 15010046 | 0.000452210 | 0.00000 | 19.2424 | 15010047 | -0.500624 | 0.501076 | 19.2300 |
| 1 | 15010042 | 0.00000 | 0.000452210 | 19.2267 | 15010043 | -0.501594 | 0.502046 | 19.2061 |
| 2 | 15010045 | -0.000209094 | 0.000661304 | 19.2084 | 15010048 | -0.500858 | 0.501310 | 19.1976 |
| 3 | 15010049 | -0.000547458 | 0.000999668 | 19.1785 | 15010044 | -0.501542 | 0.501994 | 19.1725 |