| Red | Green | Blue | |
| z | 17.64 | ||
| znorm | Inf | ||
| sky | -Inf | -NaN | -Inf |
| S/N | 29.6 | 48.7 | 50.5 |
| S/N(c) | 53.4 | 13.4 | 56.0 |
| SN(E/C) |

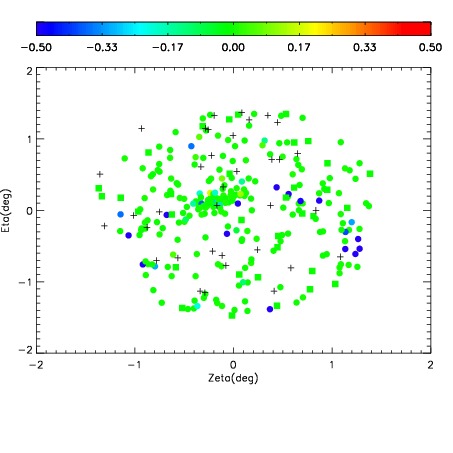
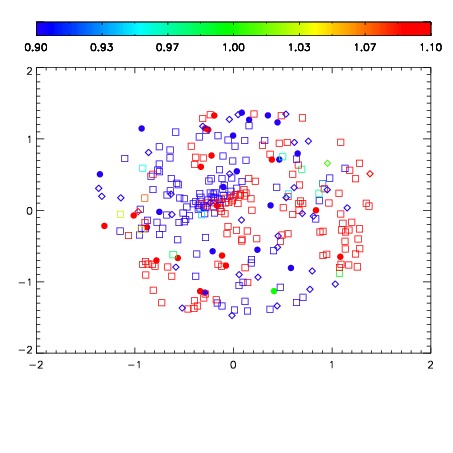


| Frame | Nreads | Zeropoints | Mag plots | Spatial mag deviation | Spatial sky 16325A emission deviations (filled: sky, open: star) | Spatial sky continuum emission | Spatial sky telluric CO2 absorption deviations (filled: H < 10) | |||||||||||||||||||||||
| 0 | 0 |
|
|
|
|
|
|
| IPAIR | NAME | SHIFT | NEWSHIFT | S/N | NAME | SHIFT | NEWSHIFT | S/N |
| 0 | 15040024 | 0.00297756 | 0.00000 | 19.1768 | 15040025 | -0.494424 | 0.497402 | 19.2133 |
| 1 | 15040023 | 0.00276999 | 0.000207570 | 19.1308 | 15040022 | -0.495499 | 0.498477 | 19.0859 |
| 2 | 15040020 | 0.00000 | 0.00297756 | 19.0444 | 15040021 | -0.495254 | 0.498232 | 19.0356 |