| Red | Green | Blue | |
| z | 17.66 | ||
| znorm | Inf | ||
| sky | -Inf | -Inf | -NaN |
| S/N | 8.6 | 16.5 | 16.8 |
| S/N(c) | 6.4 | 32.7 | 6.5 |
| SN(E/C) |
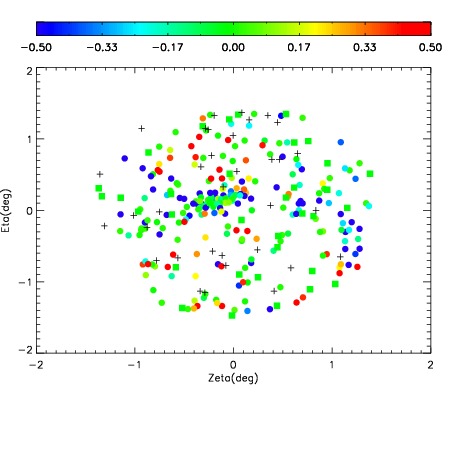

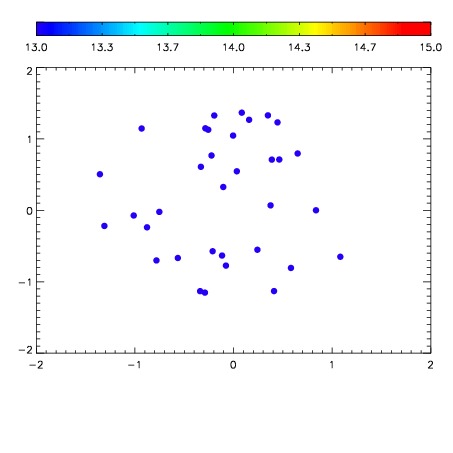

| Frame | Nreads | Zeropoints | Mag plots | Spatial mag deviation | Spatial sky 16325A emission deviations (filled: sky, open: star) | Spatial sky continuum emission | Spatial sky telluric CO2 absorption deviations (filled: H < 10) | |||||||||||||||||||||||
| 0 | 0 |
|
|
|
|
|
|
| IPAIR | NAME | SHIFT | NEWSHIFT | S/N | NAME | SHIFT | NEWSHIFT | S/N |
| 0 | 15260072 | 0.506335 | 0.00000 | 17.1631 | 15260074 | 0.000210133 | 0.506125 | 17.3478 |
| 1 | 15260071 | 0.505478 | 0.000856996 | 17.6413 | 15260070 | 0.00000 | 0.506335 | 17.5380 |
| 2 | 15260075 | 0.505652 | 0.000683010 | 17.3354 | 15260073 | 0.000184756 | 0.506150 | 17.4465 |
| 3 | 15260076 | 0.505860 | 0.000475049 | 16.9701 | 15260077 | -0.000786868 | 0.507122 | 15.6570 |