| Red | Green | Blue | |
| z | 17.64 | ||
| znorm | Inf | ||
| sky | -NaN | -Inf | -NaN |
| S/N | 29.7 | 49.6 | 52.3 |
| S/N(c) | 20.6 | 92.8 | 65.4 |
| SN(E/C) |
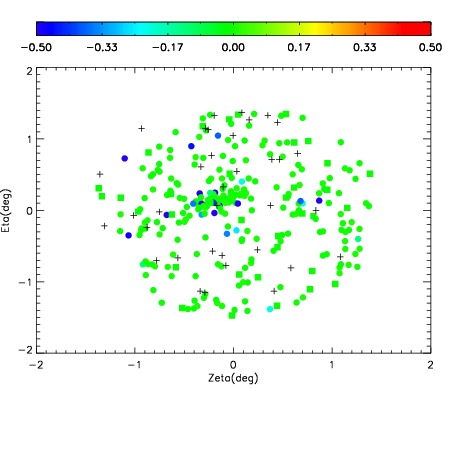
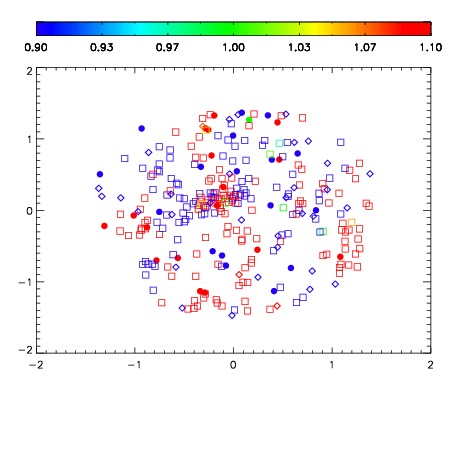
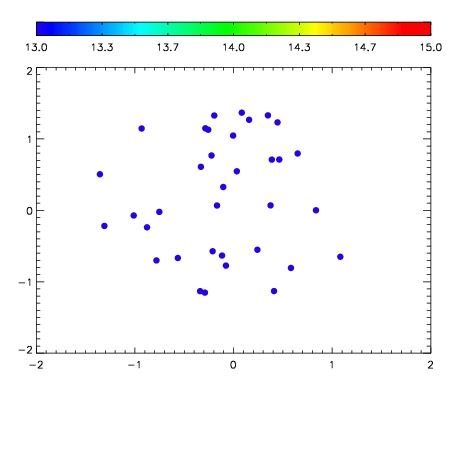

| Frame | Nreads | Zeropoints | Mag plots | Spatial mag deviation | Spatial sky 16325A emission deviations (filled: sky, open: star) | Spatial sky continuum emission | Spatial sky telluric CO2 absorption deviations (filled: H < 10) | |||||||||||||||||||||||
| 0 | 0 |
|
|
|
|
|
|
| IPAIR | NAME | SHIFT | NEWSHIFT | S/N | NAME | SHIFT | NEWSHIFT | S/N |
| 0 | 15310039 | 0.498025 | 0.00000 | 19.0409 | 15310037 | 0.00000 | 0.498025 | 19.0159 |
| 1 | 15310043 | 0.497403 | 0.000622004 | 19.1488 | 15310044 | 0.00122856 | 0.496796 | 19.1409 |
| 2 | 15310038 | 0.497877 | 0.000147998 | 19.0940 | 15310041 | 0.00213372 | 0.495891 | 19.0886 |
| 3 | 15310042 | 0.497071 | 0.000954002 | 19.0223 | 15310040 | 0.00248741 | 0.495538 | 19.0075 |