| Red | Green | Blue | |
| z | 17.71 | ||
| znorm | Inf | ||
| sky | -Inf | -Inf | -Inf |
| S/N | 2.5 | 3.7 | 4.0 |
| S/N(c) | 2.0 | 8.8 | 10.0 |
| SN(E/C) |
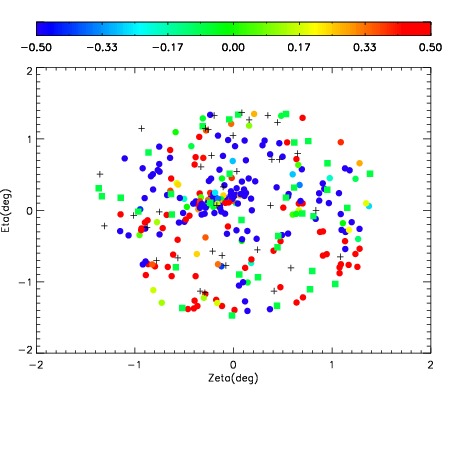
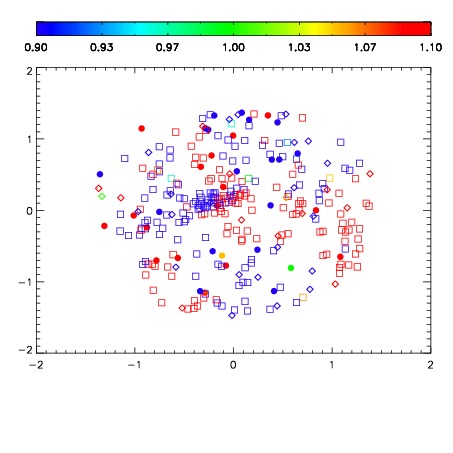
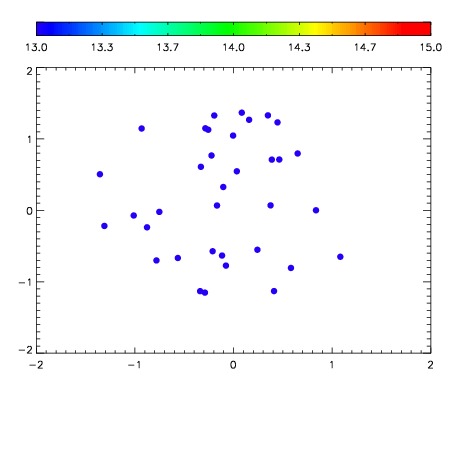

| Frame | Nreads | Zeropoints | Mag plots | Spatial mag deviation | Spatial sky 16325A emission deviations (filled: sky, open: star) | Spatial sky continuum emission | Spatial sky telluric CO2 absorption deviations (filled: H < 10) | |||||||||||||||||||||||
| 0 | 0 |
|
|
|
|
|
|
| IPAIR | NAME | SHIFT | NEWSHIFT | S/N | NAME | SHIFT | NEWSHIFT | S/N |
| 0 | 15530050 | 0.00251317 | 0.00000 | 17.0795 | 15530048 | -0.491620 | 0.494133 | 16.4110 |
| 1 | 15530047 | 0.00000 | 0.00251317 | 16.0699 | 15530049 | -0.492580 | 0.495093 | 15.7285 |