| Red | Green | Blue | |
| z | 17.65 | ||
| znorm | Inf | ||
| sky | -Inf | -Inf | -NaN |
| S/N | 23.4 | 35.7 | 38.4 |
| S/N(c) | 14.4 | 63.2 | 68.7 |
| SN(E/C) |
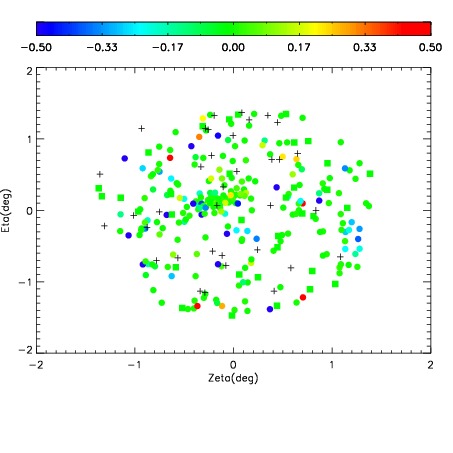
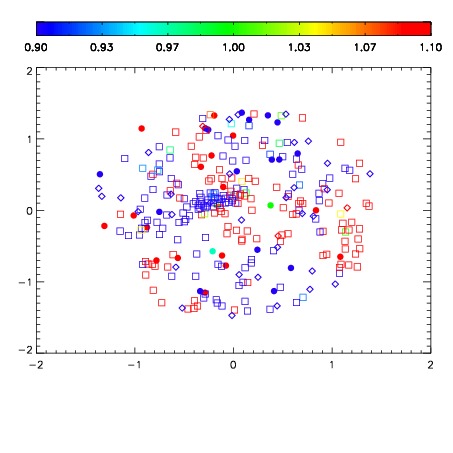


| Frame | Nreads | Zeropoints | Mag plots | Spatial mag deviation | Spatial sky 16325A emission deviations (filled: sky, open: star) | Spatial sky continuum emission | Spatial sky telluric CO2 absorption deviations (filled: H < 10) | |||||||||||||||||||||||
| 0 | 0 |
|
|
|
|
|
|
| IPAIR | NAME | SHIFT | NEWSHIFT | S/N | NAME | SHIFT | NEWSHIFT | S/N |
| 0 | 15550053 | 0.00000 | 0.00000 | 19.3957 | 15550055 | -0.491259 | 0.491259 | 19.1088 |
| 1 | 15550056 | -9.86401e-05 | 9.86401e-05 | 18.6496 | 15550054 | -0.491236 | 0.491236 | 18.8870 |