| Red | Green | Blue | |
| z | 17.64 | ||
| znorm | Inf | ||
| sky | -Inf | -Inf | -NaN |
| S/N | 27.0 | 49.1 | 53.4 |
| S/N(c) | 32.9 | 39.7 | 27.2 |
| SN(E/C) |
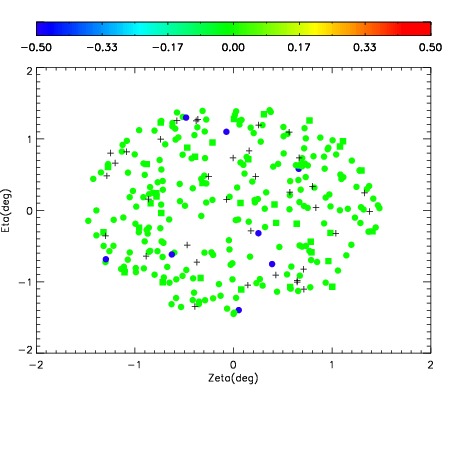
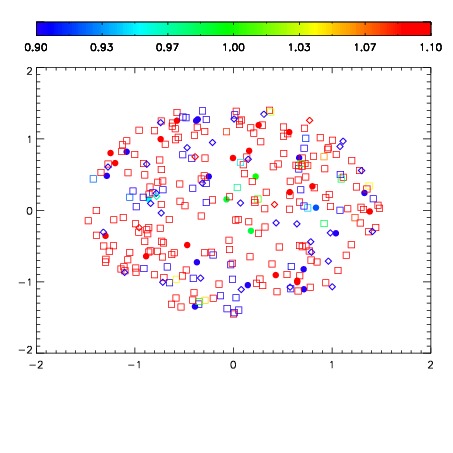
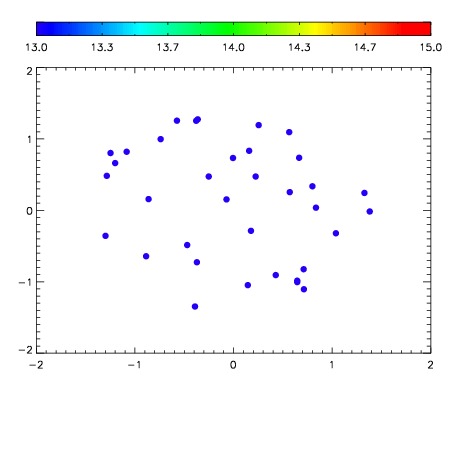

| Frame | Nreads | Zeropoints | Mag plots | Spatial mag deviation | Spatial sky 16325A emission deviations (filled: sky, open: star) | Spatial sky continuum emission | Spatial sky telluric CO2 absorption deviations (filled: H < 10) | |||||||||||||||||||||||
| 0 | 0 |
|
|
|
|
|
|
| IPAIR | NAME | SHIFT | NEWSHIFT | S/N | NAME | SHIFT | NEWSHIFT | S/N |
| 0 | 15810037 | 0.487238 | 0.00000 | 18.9094 | 15810038 | 0.00195851 | 0.485279 | 18.9212 |
| 1 | 15810036 | 0.486893 | 0.000344992 | 18.9956 | 15810042 | -0.000162797 | 0.487401 | 19.0014 |
| 2 | 15810041 | 0.485953 | 0.00128499 | 18.9913 | 15810035 | 0.00000 | 0.487238 | 18.9303 |
| 3 | 15810040 | 0.485851 | 0.00138700 | 18.8754 | 15810039 | 0.00114718 | 0.486091 | 18.8421 |