| Red | Green | Blue | |
| z | 17.64 | ||
| znorm | Inf | ||
| sky | -Inf | -Inf | -Inf |
| S/N | 28.7 | 50.8 | 53.6 |
| S/N(c) | 34.3 | 40.8 | 28.6 |
| SN(E/C) |
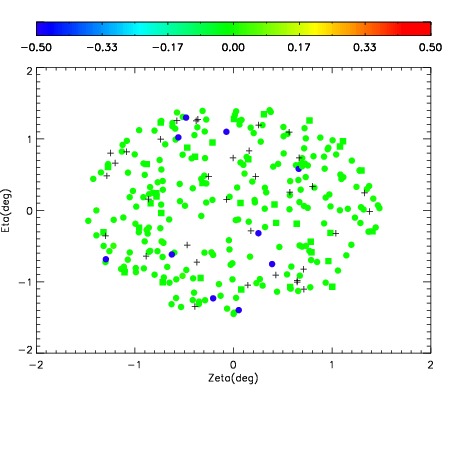
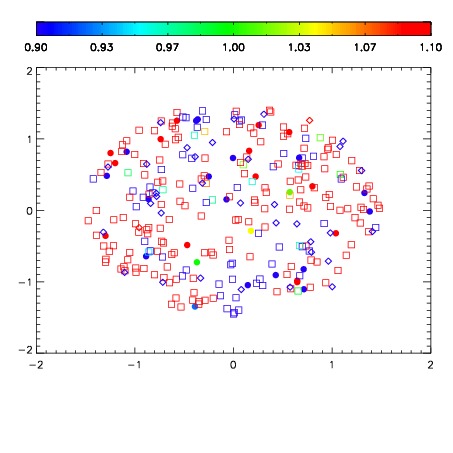
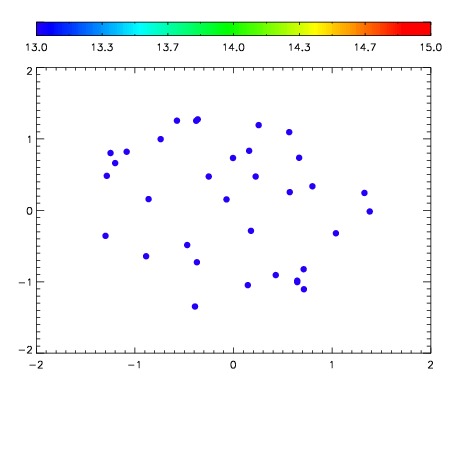

| Frame | Nreads | Zeropoints | Mag plots | Spatial mag deviation | Spatial sky 16325A emission deviations (filled: sky, open: star) | Spatial sky continuum emission | Spatial sky telluric CO2 absorption deviations (filled: H < 10) | |||||||||||||||||||||||
| 0 | 0 |
|
|
|
|
|
|
| IPAIR | NAME | SHIFT | NEWSHIFT | S/N | NAME | SHIFT | NEWSHIFT | S/N |
| 0 | 15870023 | 0.00128730 | 0.00000 | 19.0901 | 15870024 | -0.487819 | 0.489106 | 19.0814 |
| 1 | 15870022 | 0.000383997 | 0.000903303 | 19.1106 | 15870020 | -0.488621 | 0.489908 | 19.1165 |
| 2 | 15870019 | 0.00000 | 0.00128730 | 19.1087 | 15870021 | -0.488495 | 0.489782 | 19.1048 |
| 3 | 15870026 | -0.000204357 | 0.00149166 | 18.8780 | 15870025 | -0.487864 | 0.489151 | 19.0450 |