| Red | Green | Blue | |
| z | 17.64 | ||
| znorm | Inf | ||
| sky | -Inf | -Inf | -Inf |
| S/N | 19.9 | 34.9 | 37.5 |
| S/N(c) | 23.5 | 25.9 | 19.6 |
| SN(E/C) |
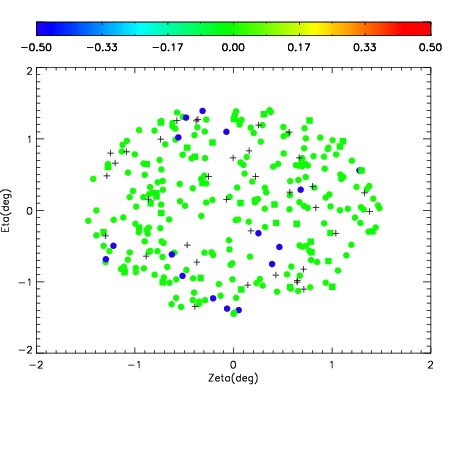
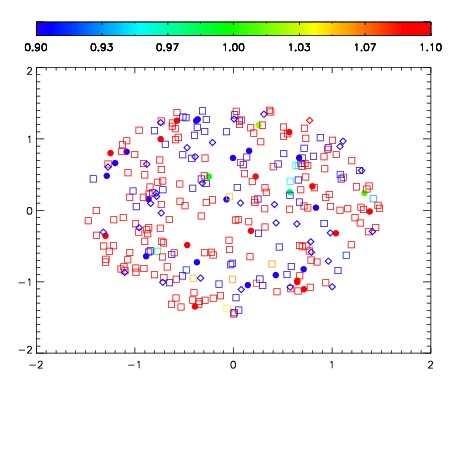
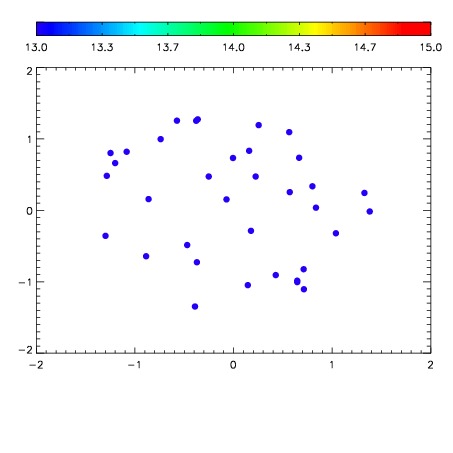

| Frame | Nreads | Zeropoints | Mag plots | Spatial mag deviation | Spatial sky 16325A emission deviations (filled: sky, open: star) | Spatial sky continuum emission | Spatial sky telluric CO2 absorption deviations (filled: H < 10) | |||||||||||||||||||||||
| 0 | 0 |
|
|
|
|
|
|
| IPAIR | NAME | SHIFT | NEWSHIFT | S/N | NAME | SHIFT | NEWSHIFT | S/N |
| 0 | 16130013 | 0.496349 | 0.00000 | 19.0149 | 16130011 | 0.00000 | 0.496349 | 19.0301 |
| 1 | 16130012 | 0.495304 | 0.00104502 | 19.0043 | 16130014 | 0.00222515 | 0.494124 | 19.0297 |