| Red | Green | Blue | |
| z | 17.64 | ||
| znorm | Inf | ||
| sky | -Inf | -Inf | -Inf |
| S/N | 16.6 | 31.9 | 33.2 |
| S/N(c) | 30.6 | 63.8 | 42.6 |
| SN(E/C) |
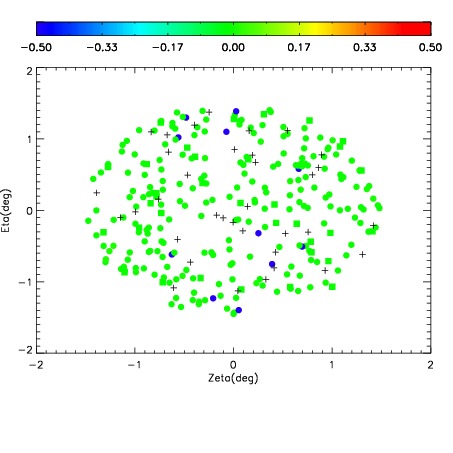
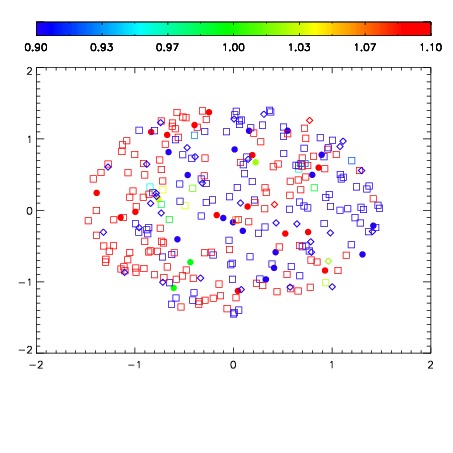
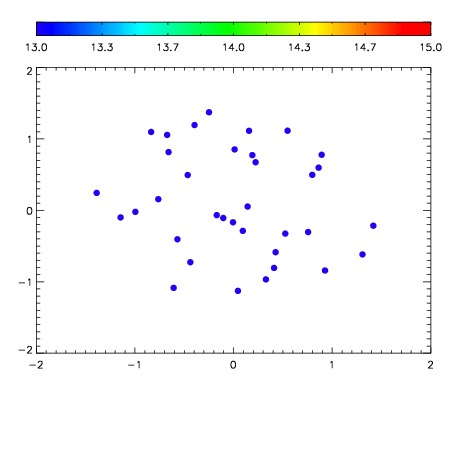

| Frame | Nreads | Zeropoints | Mag plots | Spatial mag deviation | Spatial sky 16325A emission deviations (filled: sky, open: star) | Spatial sky continuum emission | Spatial sky telluric CO2 absorption deviations (filled: H < 10) | |||||||||||||||||||||||
| 0 | 0 |
|
|
|
|
|
|
| IPAIR | NAME | SHIFT | NEWSHIFT | S/N | NAME | SHIFT | NEWSHIFT | S/N |
| 0 | 16090028 | 0.492824 | 0.00000 | 18.8636 | 16090027 | 0.00195439 | 0.490870 | 18.9149 |
| 1 | 16090024 | 0.491351 | 0.00147298 | 19.0098 | 16090023 | 0.00000 | 0.492824 | 19.0268 |
| 2 | 16090025 | 0.492336 | 0.000487983 | 18.9753 | 16090026 | 0.00252518 | 0.490299 | 18.9453 |
| 3 | 16090029 | 0.491933 | 0.000891000 | 18.7313 | 16090030 | 0.000726393 | 0.492098 | 18.8054 |