| Red | Green | Blue | |
| z | 17.64 | ||
| znorm | Inf | ||
| sky | -Inf | -Inf | -Inf |
| S/N | 21.2 | 39.2 | 45.2 |
| S/N(c) | 46.5 | 60.9 | 60.6 |
| SN(E/C) |
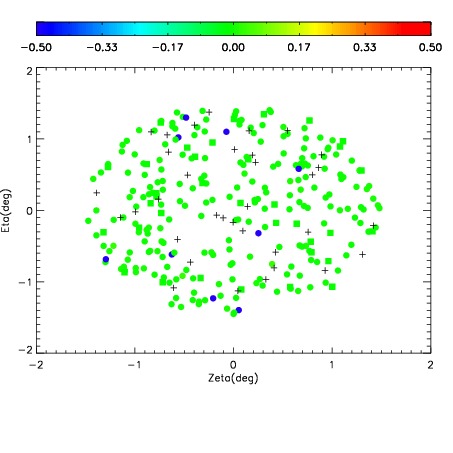
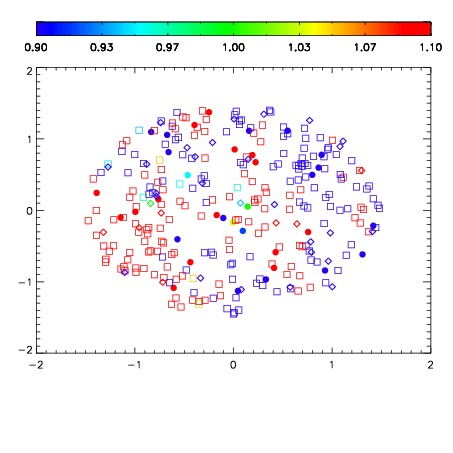
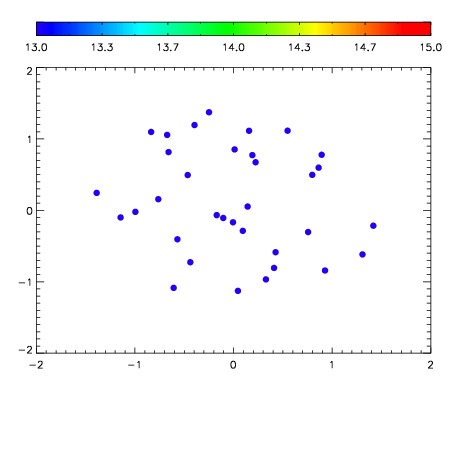

| Frame | Nreads | Zeropoints | Mag plots | Spatial mag deviation | Spatial sky 16325A emission deviations (filled: sky, open: star) | Spatial sky continuum emission | Spatial sky telluric CO2 absorption deviations (filled: H < 10) | |||||||||||||||||||||||
| 0 | 0 |
|
|
|
|
|
|
| IPAIR | NAME | SHIFT | NEWSHIFT | S/N | NAME | SHIFT | NEWSHIFT | S/N |
| 0 | 18470094 | 0.505804 | 0.00000 | 18.7076 | 18470091 | 0.000842131 | 0.504962 | 18.6588 |
| 1 | 18470097 | 0.505466 | 0.000338018 | 18.8130 | 18470096 | 0.00273845 | 0.503066 | 18.7559 |
| 2 | 18470089 | 0.504459 | 0.00134498 | 18.7647 | 18470088 | 0.00000 | 0.505804 | 18.7140 |
| 3 | 18470090 | 0.505029 | 0.000774980 | 18.7332 | 18470095 | 0.00283925 | 0.502965 | 18.6662 |
| 4 | 18470093 | 0.503754 | 0.00204998 | 18.6578 | 18470092 | 0.00101696 | 0.504787 | 18.5107 |