| Red | Green | Blue | |
| z | 17.64 | ||
| znorm | Inf | ||
| sky | -Inf | -Inf | -NaN |
| S/N | 36.3 | 62.1 | 74.3 |
| S/N(c) | 23.4 | 60.1 | 96.5 |
| SN(E/C) |
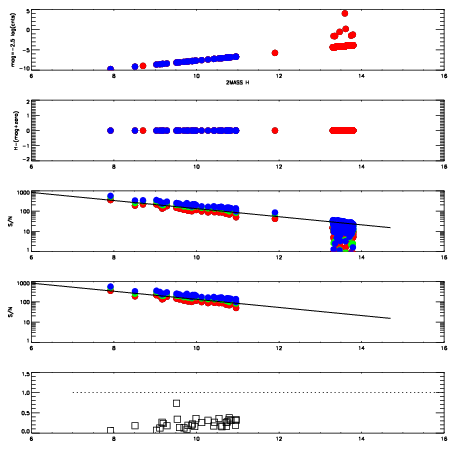
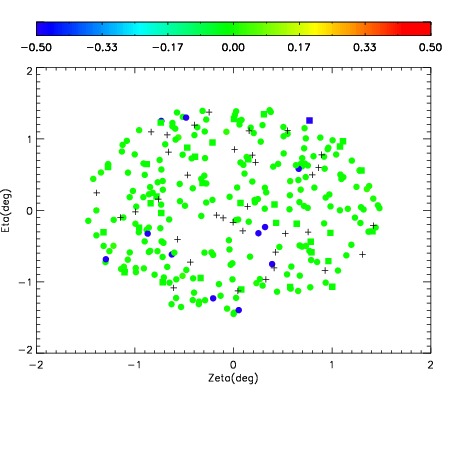
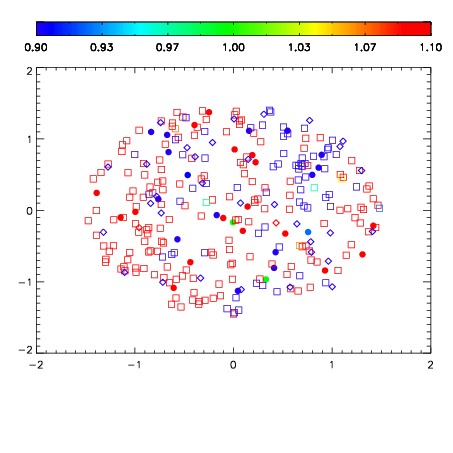
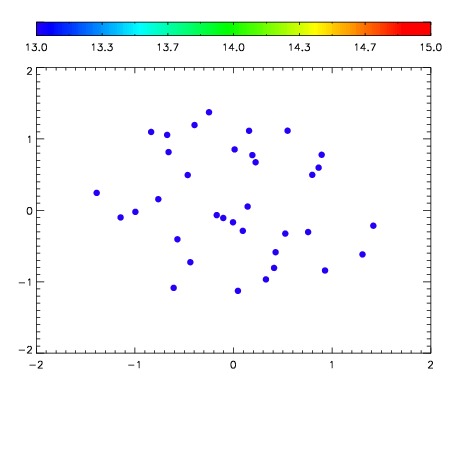

| Frame | Nreads | Zeropoints | Mag plots | Spatial mag deviation | Spatial sky 16325A emission deviations (filled: sky, open: star) | Spatial sky continuum emission | Spatial sky telluric CO2 absorption deviations (filled: H < 10) | |||||||||||||||||||||||
| 0 | 0 |
|
|
|
|
|
|
| IPAIR | NAME | SHIFT | NEWSHIFT | S/N | NAME | SHIFT | NEWSHIFT | S/N |
| 0 | 18530071 | 0.497401 | 0.00000 | 19.1096 | 18530070 | 0.00280857 | 0.494592 | 19.1003 |
| 1 | 18530063 | 0.494402 | 0.00299901 | 19.1215 | 18530066 | 0.00226383 | 0.495137 | 19.1207 |
| 2 | 18530064 | 0.494250 | 0.00315100 | 19.0606 | 18530065 | 0.00236175 | 0.495039 | 19.0888 |
| 3 | 18530067 | 0.494776 | 0.00262499 | 19.0568 | 18530062 | 0.00000 | 0.497401 | 19.0880 |
| 4 | 18530068 | 0.495356 | 0.00204501 | 19.0347 | 18530069 | 0.00273888 | 0.494662 | 19.0713 |