| Red | Green | Blue | |
| z | 17.64 | ||
| znorm | Inf | ||
| sky | -Inf | -Inf | -Inf |
| S/N | 27.3 | 45.6 | 52.6 |
| S/N(c) | 45.0 | 17.3 | 65.2 |
| SN(E/C) |
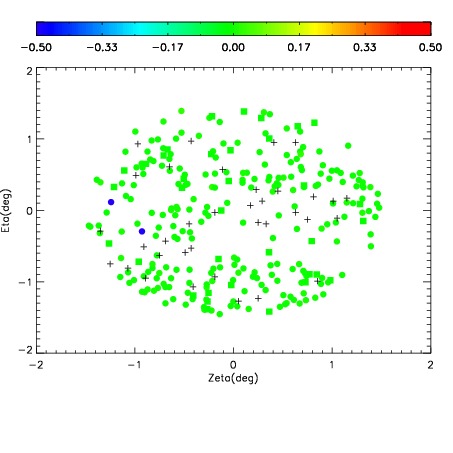
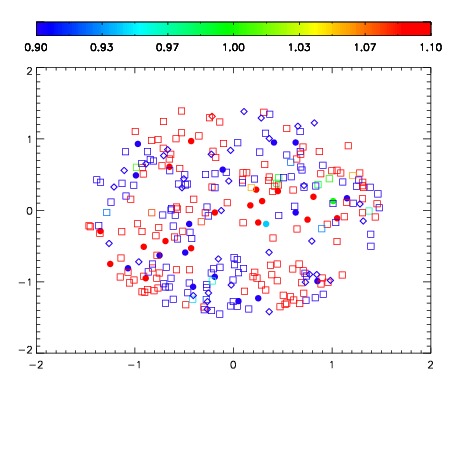


| Frame | Nreads | Zeropoints | Mag plots | Spatial mag deviation | Spatial sky 16325A emission deviations (filled: sky, open: star) | Spatial sky continuum emission | Spatial sky telluric CO2 absorption deviations (filled: H < 10) | |||||||||||||||||||||||
| 0 | 0 |
|
|
|
|
|
|
| IPAIR | NAME | SHIFT | NEWSHIFT | S/N | NAME | SHIFT | NEWSHIFT | S/N |
| 0 | 18740057 | 0.00610884 | 0.00000 | 18.8909 | 18740054 | -0.497132 | 0.503241 | 18.7711 |
| 1 | 18740060 | 0.00591545 | 0.000193390 | 18.9225 | 18740059 | -0.494141 | 0.500250 | 18.8516 |
| 2 | 18740056 | 0.00478833 | 0.00132051 | 18.7427 | 18740058 | -0.494731 | 0.500840 | 18.7679 |
| 3 | 18740053 | 0.00000 | 0.00610884 | 18.7259 | 18740055 | -0.497175 | 0.503284 | 18.7415 |