| Red | Green | Blue | |
| z | 17.64 | ||
| znorm | Inf | ||
| sky | -Inf | -Inf | -NaN |
| S/N | 32.0 | 58.0 | 62.5 |
| S/N(c) | 0.0 | 0.0 | 0.0 |
| SN(E/C) |
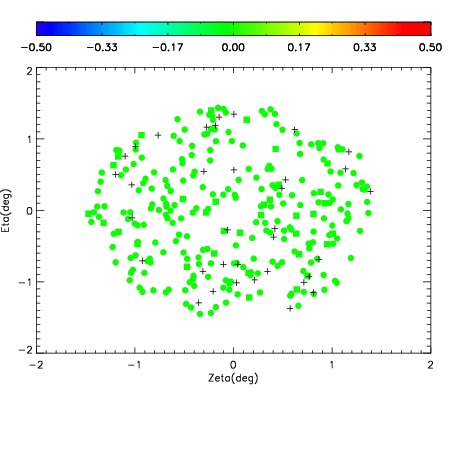
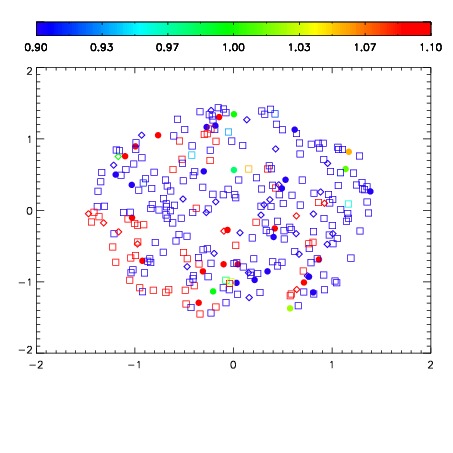
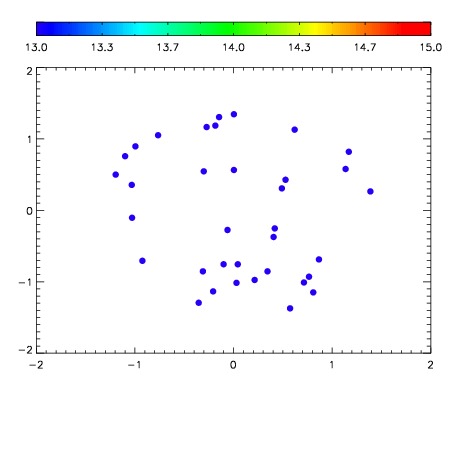

| Frame | Nreads | Zeropoints | Mag plots | Spatial mag deviation | Spatial sky 16325A emission deviations (filled: sky, open: star) | Spatial sky continuum emission | Spatial sky telluric CO2 absorption deviations (filled: H < 10) | |||||||||||||||||||||||
| 0 | 0 |
|
|
|
|
|
|
| IPAIR | NAME | SHIFT | NEWSHIFT | S/N | NAME | SHIFT | NEWSHIFT | S/N |
| 0 | 15360020 | 0.497694 | 0.00000 | 17.8004 | 15360019 | 0.00345594 | 0.494238 | 17.8390 |
| 1 | 15360028 | 0.496168 | 0.00152600 | 18.5735 | 15360027 | 0.00515122 | 0.492543 | 18.6106 |
| 2 | 15360029 | 0.496466 | 0.00122797 | 18.4173 | 15360022 | 0.00341197 | 0.494282 | 18.4824 |
| 3 | 15360025 | 0.496882 | 0.000811994 | 18.3182 | 15360030 | 0.00449761 | 0.493196 | 18.4330 |
| 4 | 15360032 | 0.495129 | 0.00256500 | 18.3112 | 15360015 | 0.00181713 | 0.495877 | 18.3730 |
| 5 | 15360021 | 0.497679 | 1.49906e-05 | 18.2990 | 15360031 | 0.00469745 | 0.492997 | 18.2528 |
| 6 | 15360016 | 0.494409 | 0.00328499 | 18.2385 | 15360026 | 0.00539146 | 0.492303 | 18.2326 |
| 7 | 15360024 | 0.495342 | 0.00235200 | 18.2057 | 15360023 | 0.00362420 | 0.494070 | 18.1218 |
| 8 | 15360033 | 0.494481 | 0.00321299 | 18.1852 | 15360035 | 0.00347165 | 0.494222 | 18.0240 |
| 9 | 15360013 | 0.495188 | 0.00250599 | 17.8148 | 15360018 | 0.00283931 | 0.494855 | 17.9221 |
| 10 | 15360012 | 0.494371 | 0.00332299 | 17.6814 | 15360014 | 0.00242086 | 0.495273 | 17.7523 |
| 11 | 15360017 | 0.496351 | 0.00134298 | 16.9560 | 15360011 | 0.00000 | 0.497694 | 17.7291 |
| 12 | 15360036 | 0.494005 | 0.00368899 | 16.0180 | 15360034 | 0.00363063 | 0.494063 | 17.7278 |