| Red | Green | Blue | |
| z | 17.64 | ||
| znorm | Inf | ||
| sky | -NaN | -NaN | -NaN |
| S/N | 19.8 | 39.9 | 40.1 |
| S/N(c) | 0.0 | 0.0 | 0.0 |
| SN(E/C) |
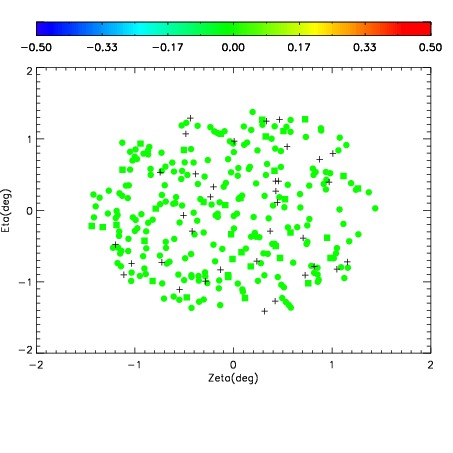
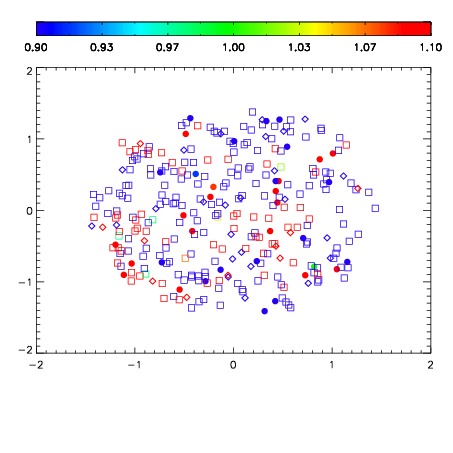


| Frame | Nreads | Zeropoints | Mag plots | Spatial mag deviation | Spatial sky 16325A emission deviations (filled: sky, open: star) | Spatial sky continuum emission | Spatial sky telluric CO2 absorption deviations (filled: H < 10) | |||||||||||||||||||||||
| 0 | 0 |
|
|
|
|
|
|
| IPAIR | NAME | SHIFT | NEWSHIFT | S/N | NAME | SHIFT | NEWSHIFT | S/N |
| 0 | 15350013 | 0.495881 | 0.00000 | 17.8352 | 15350018 | 0.000688427 | 0.495193 | 17.9473 |
| 1 | 15350016 | 0.494850 | 0.00103098 | 18.5951 | 15350022 | -0.000540636 | 0.496422 | 18.6088 |
| 2 | 15350029 | 0.491207 | 0.00467399 | 18.5625 | 15350015 | 0.000499437 | 0.495382 | 18.5744 |
| 3 | 15350028 | 0.491568 | 0.00431299 | 18.4785 | 15350030 | -0.000567273 | 0.496448 | 18.5376 |
| 4 | 15350021 | 0.493034 | 0.00284699 | 18.4736 | 15350027 | -0.000771713 | 0.496653 | 18.4244 |
| 5 | 15350032 | 0.490419 | 0.00546199 | 18.4191 | 15350031 | -0.000576821 | 0.496458 | 18.4059 |
| 6 | 15350025 | 0.492271 | 0.00360999 | 18.2499 | 15350026 | 0.000241969 | 0.495639 | 18.2854 |
| 7 | 15350033 | 0.490369 | 0.00551200 | 18.1620 | 15350034 | -0.00113064 | 0.497012 | 18.1012 |
| 8 | 15350024 | 0.491790 | 0.00409099 | 18.0916 | 15350023 | -0.000106621 | 0.495988 | 18.0641 |
| 9 | 15350020 | 0.493168 | 0.00271299 | 18.0127 | 15350019 | 0.000704986 | 0.495176 | 17.9714 |
| 10 | 15350017 | 0.495669 | 0.000211984 | 17.9816 | 15350014 | 0.000880369 | 0.495001 | 17.9520 |
| 11 | 15350012 | 0.495457 | 0.000423998 | 17.7404 | 15350011 | 0.00000 | 0.495881 | 17.6524 |