| Red | Green | Blue | |
| z | 17.64 | ||
| znorm | Inf | ||
| sky | -Inf | -Inf | -Inf |
| S/N | 18.1 | 34.8 | 35.9 |
| S/N(c) | 0.0 | 0.0 | 0.0 |
| SN(E/C) |
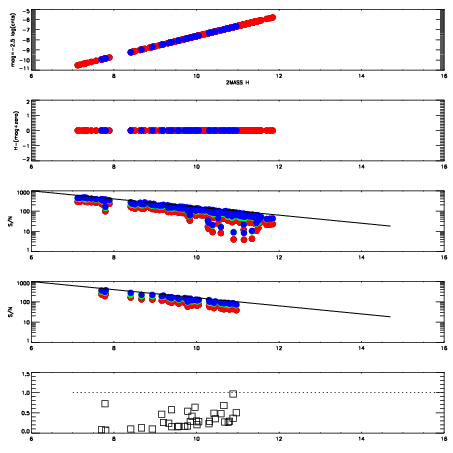
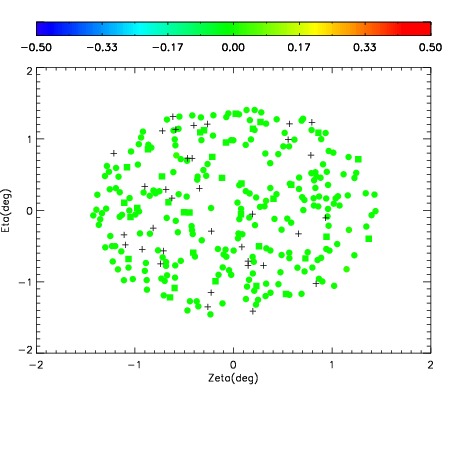
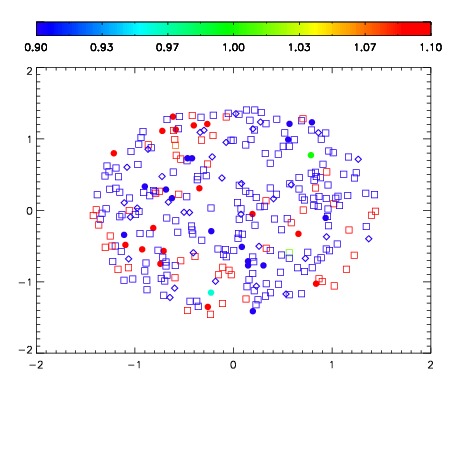


| Frame | Nreads | Zeropoints | Mag plots | Spatial mag deviation | Spatial sky 16325A emission deviations (filled: sky, open: star) | Spatial sky continuum emission | Spatial sky telluric CO2 absorption deviations (filled: H < 10) | |||||||||||||||||||||||
| 0 | 0 |
|
|
|
|
|
|
| IPAIR | NAME | SHIFT | NEWSHIFT | S/N | NAME | SHIFT | NEWSHIFT | S/N |
| 0 | 15720072 | 0.488721 | 0.00000 | 17.7995 | 15720058 | 0.00000 | 0.488721 | 16.9958 |
| 1 | 15720060 | 0.487574 | 0.00114700 | 18.3148 | 15720070 | -0.000509565 | 0.489231 | 18.3965 |
| 2 | 15720071 | 0.487266 | 0.00145501 | 18.2328 | 15720061 | -0.000625191 | 0.489346 | 18.3608 |
| 3 | 15720063 | 0.486520 | 0.00220102 | 18.1052 | 15720073 | -0.000329940 | 0.489051 | 18.1938 |
| 4 | 15720068 | 0.486738 | 0.00198302 | 17.8708 | 15720069 | -0.000738256 | 0.489459 | 18.1033 |
| 5 | 15720064 | 0.486684 | 0.00203702 | 17.6875 | 15720062 | -0.000533687 | 0.489255 | 16.6505 |
| 6 | 15720059 | 0.487629 | 0.00109202 | 17.5284 | 15720066 | 0.00112742 | 0.487594 | 15.6130 |
| 7 | 15720067 | 0.487661 | 0.00106001 | 17.1434 | 15720065 | 0.000863041 | 0.487858 | 14.6071 |