| Red | Green | Blue | |
| z | 17.64 | ||
| znorm | Inf | ||
| sky | -Inf | -Inf | -NaN |
| S/N | 20.6 | 39.8 | 40.9 |
| S/N(c) | 0.0 | 0.0 | 0.0 |
| SN(E/C) |
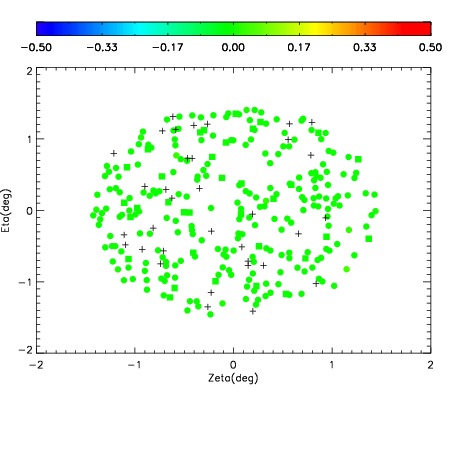
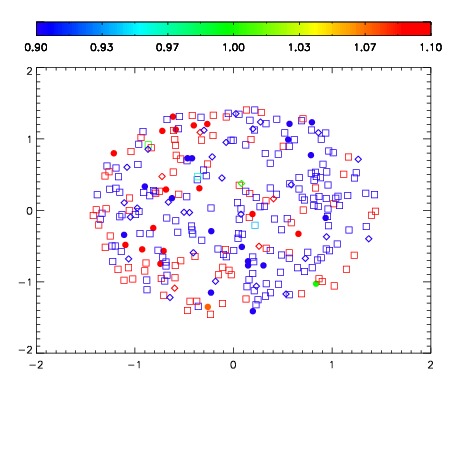
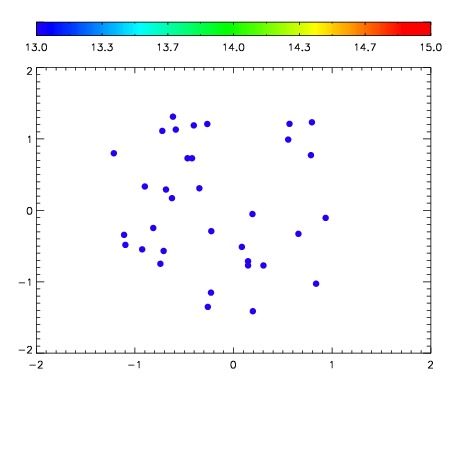

| Frame | Nreads | Zeropoints | Mag plots | Spatial mag deviation | Spatial sky 16325A emission deviations (filled: sky, open: star) | Spatial sky continuum emission | Spatial sky telluric CO2 absorption deviations (filled: H < 10) | |||||||||||||||||||||||
| 0 | 0 |
|
|
|
|
|
|
| IPAIR | NAME | SHIFT | NEWSHIFT | S/N | NAME | SHIFT | NEWSHIFT | S/N |
| 0 | 15730073 | 0.489264 | 0.00000 | 17.6753 | 15730072 | 0.000748212 | 0.488516 | 17.6102 |
| 1 | 15730066 | 0.487183 | 0.00208101 | 18.4650 | 15730067 | 0.000577602 | 0.488686 | 18.5488 |
| 2 | 15730070 | 0.488388 | 0.000876009 | 18.3506 | 15730079 | 0.00166536 | 0.487599 | 18.2059 |
| 3 | 15730077 | 0.487195 | 0.00206903 | 18.3065 | 15730064 | 0.00000 | 0.489264 | 18.1890 |
| 4 | 15730078 | 0.487717 | 0.00154701 | 18.2023 | 15730076 | 0.000909821 | 0.488354 | 18.1546 |
| 5 | 15730065 | 0.487664 | 0.00160000 | 18.1867 | 15730071 | 0.000363311 | 0.488901 | 17.9729 |
| 6 | 15730081 | 0.487794 | 0.00147000 | 17.6930 | 15730075 | 0.000970499 | 0.488293 | 17.7703 |
| 7 | 15730074 | 0.489099 | 0.000165015 | 17.5714 | 15730080 | 0.00123869 | 0.488025 | 17.5267 |
| 8 | 15730069 | 0.488570 | 0.000694007 | 17.0177 | 15730068 | 0.00215461 | 0.487109 | 16.5273 |