| Red | Green | Blue | |
| z | 17.64 | ||
| znorm | Inf | ||
| sky | -Inf | -Inf | -Inf |
| S/N | 15.0 | 28.2 | 29.0 |
| S/N(c) | 0.0 | 0.0 | 0.0 |
| SN(E/C) |
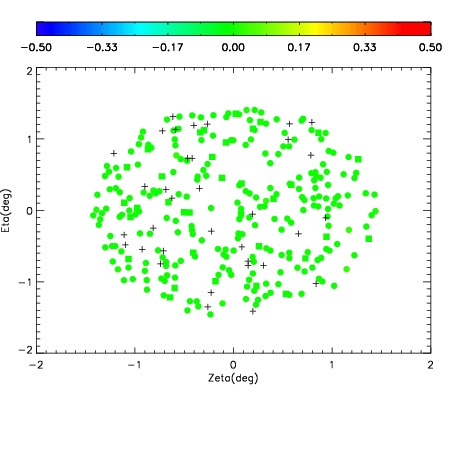
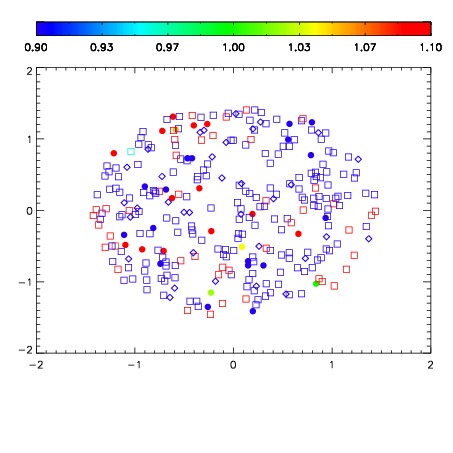
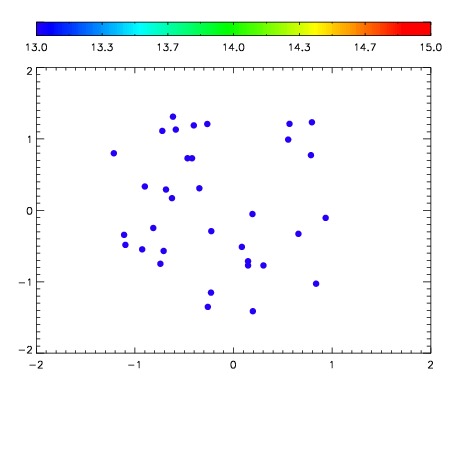

| Frame | Nreads | Zeropoints | Mag plots | Spatial mag deviation | Spatial sky 16325A emission deviations (filled: sky, open: star) | Spatial sky continuum emission | Spatial sky telluric CO2 absorption deviations (filled: H < 10) | |||||||||||||||||||||||
| 0 | 0 |
|
|
|
|
|
|
| IPAIR | NAME | SHIFT | NEWSHIFT | S/N | NAME | SHIFT | NEWSHIFT | S/N |
| 0 | 15750035 | 0.00288509 | 0.00000 | 17.9902 | 15750036 | -0.481532 | 0.484417 | 17.8744 |
| 1 | 15750034 | 0.00279307 | 9.20200e-05 | 18.5377 | 15750033 | -0.481930 | 0.484815 | 18.5222 |
| 2 | 15750031 | 0.00000 | 0.00288509 | 18.4713 | 15750032 | -0.481843 | 0.484728 | 18.4152 |