| Red | Green | Blue | |
| z | 17.64 | ||
| znorm | Inf | ||
| sky | -Inf | -Inf | -Inf |
| S/N | 8.9 | 17.7 | 18.4 |
| S/N(c) | 0.0 | 0.0 | 0.0 |
| SN(E/C) |
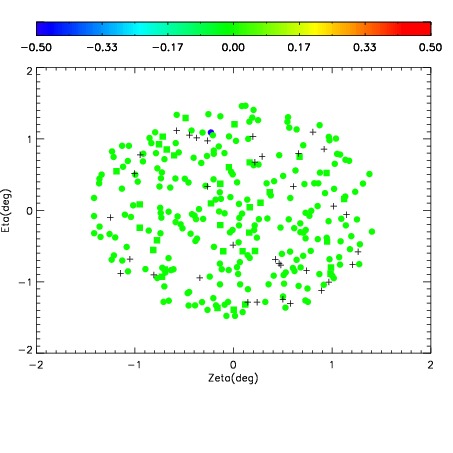
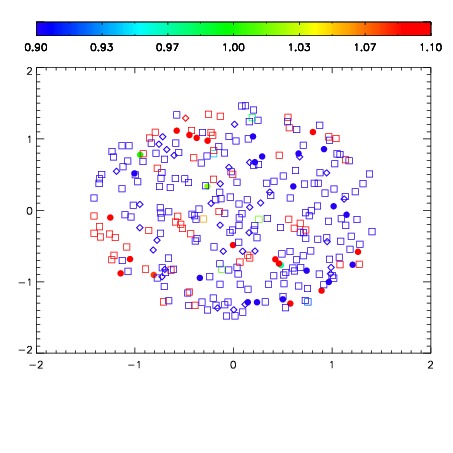
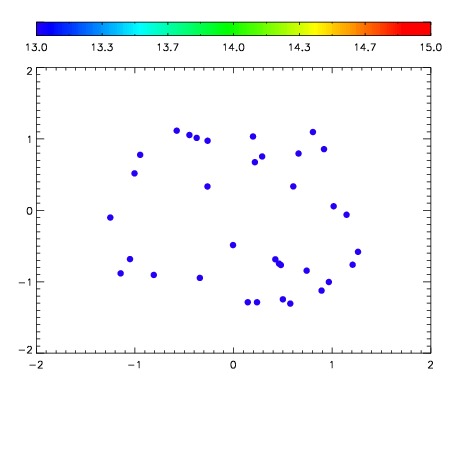

| Frame | Nreads | Zeropoints | Mag plots | Spatial mag deviation | Spatial sky 16325A emission deviations (filled: sky, open: star) | Spatial sky continuum emission | Spatial sky telluric CO2 absorption deviations (filled: H < 10) | |||||||||||||||||||||||
| 0 | 0 |
|
|
|
|
|
|
| IPAIR | NAME | SHIFT | NEWSHIFT | S/N | NAME | SHIFT | NEWSHIFT | S/N |
| 0 | 15610013 | 0.488384 | 0.00000 | 18.4183 | 15610014 | -0.00104030 | 0.489424 | 18.4027 |
| 1 | 15610012 | 0.488201 | 0.000183016 | 17.9326 | 15610011 | 0.00000 | 0.488384 | 17.7105 |
| 2 | 15610016 | 0.488249 | 0.000135005 | 17.2111 | 15610015 | -0.000645422 | 0.489029 | 17.2842 |