| Red | Green | Blue | |
| z | 17.64 | ||
| znorm | Inf | ||
| sky | -Inf | -Inf | -Inf |
| S/N | 17.4 | 33.4 | 36.1 |
| S/N(c) | 0.0 | 0.0 | 0.0 |
| SN(E/C) |
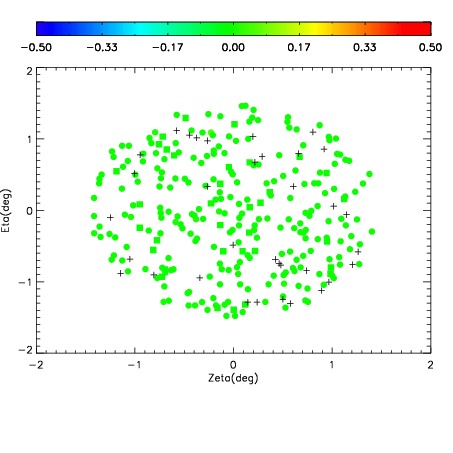

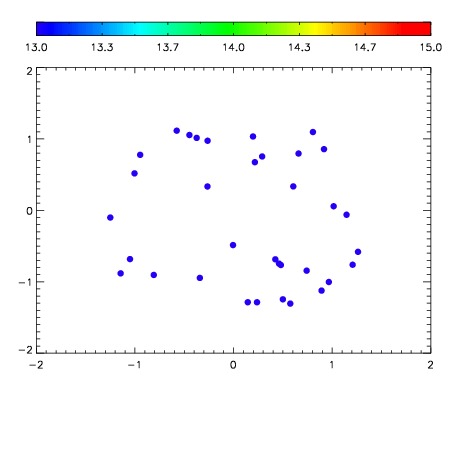

| Frame | Nreads | Zeropoints | Mag plots | Spatial mag deviation | Spatial sky 16325A emission deviations (filled: sky, open: star) | Spatial sky continuum emission | Spatial sky telluric CO2 absorption deviations (filled: H < 10) | |||||||||||||||||||||||
| 0 | 0 |
|
|
|
|
|
|
| IPAIR | NAME | SHIFT | NEWSHIFT | S/N | NAME | SHIFT | NEWSHIFT | S/N |
| 0 | 15670018 | 0.00000 | 0.00000 | 18.4003 | 15670023 | -0.491378 | 0.491378 | 18.1424 |
| 1 | 15670026 | -0.00237139 | 0.00237139 | 18.5548 | 15670027 | -0.489773 | 0.489773 | 18.5541 |
| 2 | 15670025 | -0.00322039 | 0.00322039 | 18.5187 | 15670024 | -0.491863 | 0.491863 | 18.4937 |
| 3 | 15670030 | -0.00154816 | 0.00154816 | 18.4525 | 15670019 | -0.493090 | 0.493090 | 18.4904 |
| 4 | 15670021 | -0.00264364 | 0.00264364 | 18.4111 | 15670031 | -0.490342 | 0.490342 | 18.4424 |
| 5 | 15670022 | -0.00293992 | 0.00293992 | 18.1987 | 15670028 | -0.490594 | 0.490594 | 17.9303 |
| 6 | 15670029 | -0.00166719 | 0.00166719 | 17.8208 | 15670020 | -0.492953 | 0.492953 | 17.5641 |