| Red | Green | Blue | |
| z | 17.64 | ||
| znorm | Inf | ||
| sky | -Inf | -Inf | -Inf |
| S/N | 20.8 | 38.0 | 43.7 |
| S/N(c) | 0.0 | 0.0 | 0.0 |
| SN(E/C) |
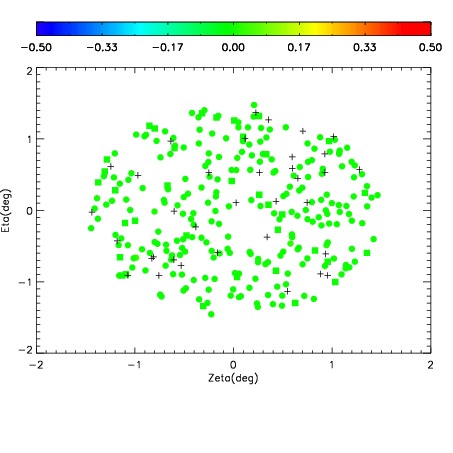
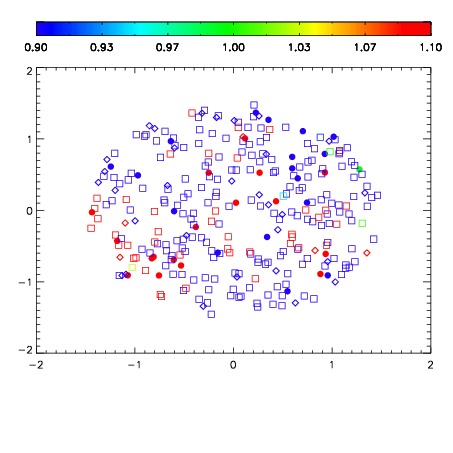


| Frame | Nreads | Zeropoints | Mag plots | Spatial mag deviation | Spatial sky 16325A emission deviations (filled: sky, open: star) | Spatial sky continuum emission | Spatial sky telluric CO2 absorption deviations (filled: H < 10) | |||||||||||||||||||||||
| 0 | 0 |
|
|
|
|
|
|
| IPAIR | NAME | SHIFT | NEWSHIFT | S/N | NAME | SHIFT | NEWSHIFT | S/N |
| 0 | 18400014 | 0.503625 | 0.00000 | 17.6669 | 18400015 | 0.00111439 | 0.502511 | 17.7722 |
| 1 | 18400022 | 0.501871 | 0.00175399 | 18.5563 | 18400023 | -0.00129622 | 0.504921 | 18.5269 |
| 2 | 18400017 | 0.502433 | 0.00119197 | 18.4409 | 18400016 | 4.83806e-05 | 0.503577 | 18.5009 |
| 3 | 18400021 | 0.501822 | 0.00180298 | 17.9650 | 18400020 | -0.00129294 | 0.504918 | 17.9691 |
| 4 | 18400018 | 0.503405 | 0.000220001 | 17.7745 | 18400019 | -0.00107736 | 0.504702 | 17.8748 |
| 5 | 18400013 | 0.503512 | 0.000112951 | 17.5723 | 18400012 | 0.00000 | 0.503625 | 17.5885 |