| Red | Green | Blue | |
| z | 17.64 | ||
| znorm | Inf | ||
| sky | -Inf | -Inf | -Inf |
| S/N | 26.2 | 44.0 | 53.6 |
| S/N(c) | 0.0 | 0.0 | 0.0 |
| SN(E/C) |
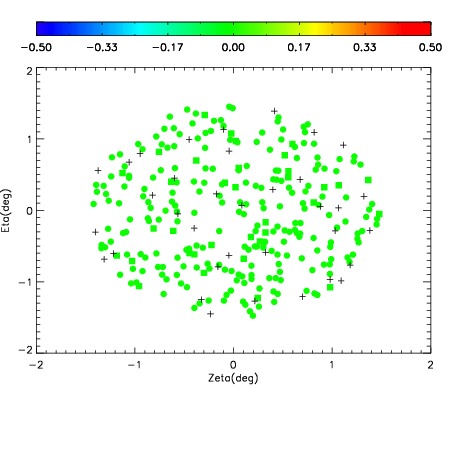
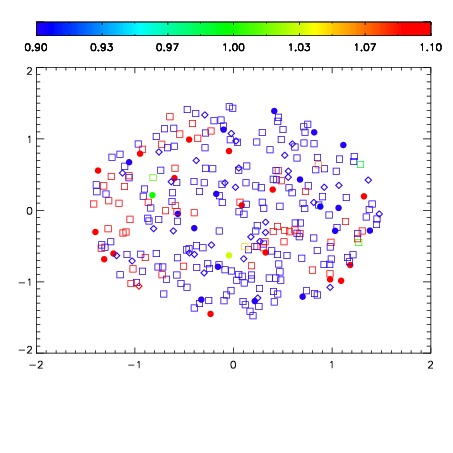
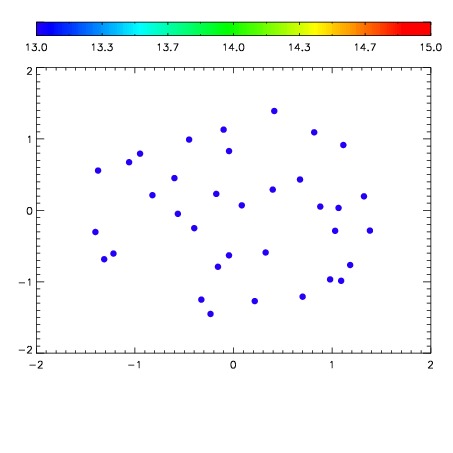

| Frame | Nreads | Zeropoints | Mag plots | Spatial mag deviation | Spatial sky 16325A emission deviations (filled: sky, open: star) | Spatial sky continuum emission | Spatial sky telluric CO2 absorption deviations (filled: H < 10) | |||||||||||||||||||||||
| 0 | 0 |
|
|
|
|
|
|
| IPAIR | NAME | SHIFT | NEWSHIFT | S/N | NAME | SHIFT | NEWSHIFT | S/N |
| 0 | 18430079 | 0.502757 | 0.00000 | 18.1313 | 18430080 | 0.000884703 | 0.501872 | 18.1513 |
| 1 | 18430082 | 0.498529 | 0.00422803 | 18.4875 | 18430081 | 2.34196e-05 | 0.502734 | 18.5999 |
| 2 | 18430090 | 0.498398 | 0.00435901 | 18.3930 | 18430089 | 0.00114287 | 0.501614 | 18.4568 |
| 3 | 18430087 | 0.497716 | 0.00504100 | 18.3256 | 18430092 | -0.000570939 | 0.503328 | 18.3478 |
| 4 | 18430091 | 0.499296 | 0.00346100 | 18.3094 | 18430084 | 0.000203236 | 0.502554 | 18.3095 |
| 5 | 18430083 | 0.499197 | 0.00356001 | 18.2545 | 18430088 | 0.00162071 | 0.501136 | 18.2816 |
| 6 | 18430086 | 0.498180 | 0.00457701 | 18.1920 | 18430093 | -0.00142042 | 0.504177 | 18.2530 |
| 7 | 18430094 | 0.496856 | 0.00590101 | 18.1468 | 18430085 | -0.000522975 | 0.503280 | 18.1635 |
| 8 | 18430078 | 0.501930 | 0.000827014 | 18.0564 | 18430077 | 0.00000 | 0.502757 | 18.0048 |