| Red | Green | Blue | |
| z | 17.64 | ||
| znorm | Inf | ||
| sky | -NaN | -Inf | -NaN |
| S/N | 26.5 | 44.9 | 45.9 |
| S/N(c) | 0.0 | 0.0 | 0.0 |
| SN(E/C) |
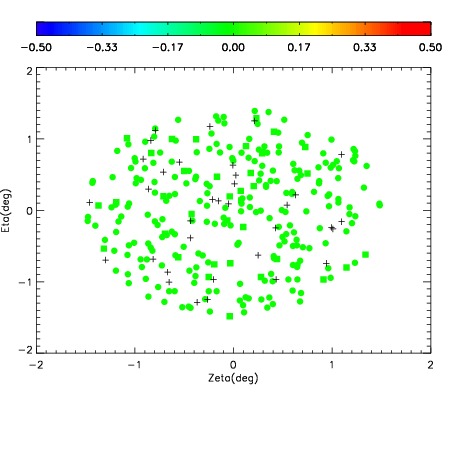
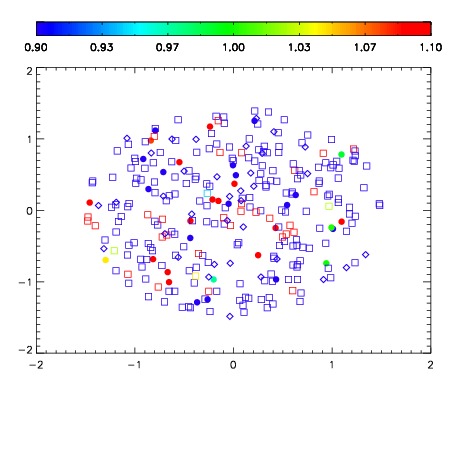
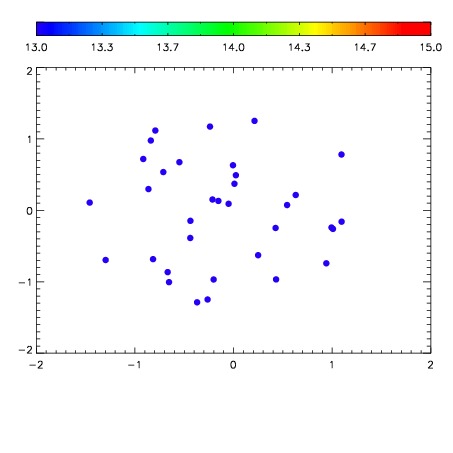

| Frame | Nreads | Zeropoints | Mag plots | Spatial mag deviation | Spatial sky 16325A emission deviations (filled: sky, open: star) | Spatial sky continuum emission | Spatial sky telluric CO2 absorption deviations (filled: H < 10) | |||||||||||||||||||||||
| 0 | 0 |
|
|
|
|
|
|
| IPAIR | NAME | SHIFT | NEWSHIFT | S/N | NAME | SHIFT | NEWSHIFT | S/N |
| 0 | 15420029 | 0.493315 | 0.00000 | 18.1601 | 15420030 | 0.00222144 | 0.491094 | 18.1809 |
| 1 | 15420032 | 0.490096 | 0.00321901 | 18.9107 | 15420031 | 0.000675141 | 0.492640 | 18.9069 |
| 2 | 15420037 | 0.491012 | 0.00230300 | 18.6878 | 15420038 | -0.00164308 | 0.494958 | 18.7611 |
| 3 | 15420036 | 0.492354 | 0.000961006 | 18.2994 | 15420027 | 0.00000 | 0.493315 | 18.3604 |
| 4 | 15420033 | 0.491389 | 0.00192600 | 18.2668 | 15420034 | -0.000400084 | 0.493715 | 18.2593 |
| 5 | 15420028 | 0.492878 | 0.000437021 | 18.2375 | 15420035 | 8.89091e-05 | 0.493226 | 18.2551 |